Amazon

Monday, October 7, 2024

SPX and INDU: Everyone's Favorite Market

Friday's market didn't do anything to change anything, so... no change from the past few updates.

INDU first:


SPX:


Of minor note, SPX appears to be three waves down followed by three waves up.  As of this second, it hasn't overlapped the start of the prior wave down, so that means if it were to break the red line directly, there would be an option for it to be a nested bear wave.  If it goes on to form another small 3-down, 3-up while the price range contracts, then we could be looking at a larger triangle continuation pattern.  If it instead were to go on to make a new ATH directly, then neither of those are relevant.  Not much else to add beyond that.  Trade safe.

Friday, October 4, 2024

SPX and INDU Updates

It's been a long-standing tradition that whenever the update falls on October the 4th, I include the word "the" somewhere in the update, so I'll do my best to honor that tradition again today.

Since last update, the market has basically just burned time going sideways, in an attempt to annoy everyone.  While this doesn't give us much information on its next move, it does give us a fairly clear support zone to work with heading forward:


INDU is in a similar position -- but to be fair, we'd already pretty much worked out that zone previously, plus a hair, this just tends to confirm it:


INDU's big picture chart still shows the zone for bulls to beat convincingly:


In conclusion, not much else to add beyond that.  Trade safe.  

The.

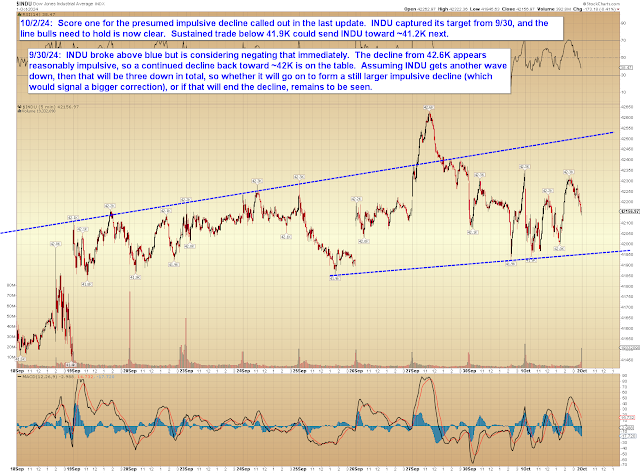
Wednesday, October 2, 2024

SPX and INDU: Target Captured

Last update observed that INDU appeared to have formed a micro impulse down and projected a decline to ~42K in INDU, which has since happened:


SPX declined as well and is in a similar position:


Long-term, INDU has so far whipsawed the breakout line:


In conclusion, if bears can keep pushing lower and form a larger impulsive decline along the way, then that could bode for a larger top at the recent all-time high.  Of course, there's still work to do to get there, but this would be a nice place for it, since almost no one was expecting that possibility.  We'll see how it plays.  Trade safe.


Monday, September 30, 2024

SPX, NYA, INDU: A Thing Has Occurred

Since last update, INDU finally broke above its major trend resistance, but it looks like it may whipsaw (I call both false breakouts and false breakdowns "whipsaws."  I realize some people use different terms depending on direction, but I don't care.).  Here's the short-term chart to explain why:


The tricky thing is that on the long-term chart, it appears INDU may still be above the breakout line, but the resolution on these very long-term charts always makes attempting to narrow things "down to the penny" a bit sketchy:


NYA's chart is a bit higher resolution and NYA does look like it's still above its line, so we'll see if that apparent micro impulse (in the first INDU chart) does its job:


Finally, SPX is just a mess of chop at all the relevant time frames, but if INDU's micro impulse down holds, then SPX will likely follow suit:


In conclusion, INDU appears that it may whipsaw its breakout -- but if it doesn't and instead goes on to run higher again, then bears should be extremely cautious for the moment.  Trade safe.

Friday, September 27, 2024

INDU and NYA: Any Title You Want

Still not much to add.  INDU is still backing and filling near its inflection zone.  I like this chart in the current environment because it provides a clear visual reference for trend resistance.  It's not unusual to see a market bounce along near a trend line (even bouncing higher) before reversing, so it provides a clearer visual guide to the inflection zone -- but it also gives fair warning to bear in the event INDU breaks and holds above that zone, as that would suggest a new burst of momentum higher.


NYA is in a similar position, but the trend line shown on NYA's chart isn't as meaningful as INDU (due to it being a shorter time frame):


In conclusion, while SPX ran a bit beyond its upside target from a month ago, that target is not the end-all to the current inflection zone, so moving a little beyond it is of minimal significance.  INDU is probably a better guide at the moment, due to its rising trend line better capturing the dynamics.  Trade safe.

Wednesday, September 25, 2024

SPX and INDU Updates

Nothing to add to the past couple updates, except to note that SPX made a new high, confirming the read that it had only formed three waves down and that north of the blue line would be trouble for bears.  I can't find the live chart to update, so I'll just reprint that chart briefly.  More than anything, this serves as the 8,347th reminder for "why I like to await an impulsive decline before getting too bearish."


SPX is still hovering near its first inflection zone:


As is INDU:


So not much to add here, other than to note that awaiting an impulsive decline is still a good idea, as it's as yet unclear whether the market is ready to start topping yet or not.  Trade safe.

Monday, September 23, 2024

SPX and INDU Updates

Following up on the prior update, the market has reacted to its inflection zone, but has not yet formed an impulsive decline, which means (as of this exact moment, anyway) bulls could still recover and make another run into the inflection zone.  The near-term levels are fairly clear, at least in terms of the high probability reads (there are always weird outliers where, for example, SPX could break above blue and then collapse, those are just lower probability).


INDU probably remains the clearest chart at the larger time frames:


In conclusion, while the market has reacted to its upside inflection zone, nothing even vaguely conclusive has yet happened, so there's not much else to add.  Trade safe.