Amazon

Monday, December 18, 2023

SPX and a Random Thought about Real Estate

So I looked through my chartbook, but there's just not a lot to say about a trending market, except that it's still trending.  As the old saying goes, "The trend is your friend -- 'til the end when it bends."  Accordingly, there's not much to add to recent updates, except to note that SPX is getting close to the zone of the old red trend line:


I also wanted to share an interesting thought (not a prediction, just a random speculation) regarding the housing market.  As we all know, just as I predicted back in April 2022, the housing market hasn't fallen, despite rising interest rates.  My speculation at the time was that rising rates would cause people to cling to their 3% mortgages, so while demand would fall from rising rates, supply would also fall, which would tend to counteract falling demand.  That's exactly what happened... then I had another thought a few months ago that went something like this:
  • When rates finally do start to fall, people who have felt "trapped" in their mortgages may finally rush their homes to market.
  • This will, of course, increase inventory.
  • Depending on how much pent-up supply lies in the wings, there's a chance that falling rates could again trigger the inverse of what everyone is expecting:  Instead of rising prices, it's not outside the realm of possibility that lower rates could lead to a supply glut, as "trapped" would-be sellers finally see a way out -- which would then trigger falling prices.
Again, that's not a prediction, because there's no reliable way to measure how many people will list their homes in a falling rate environment -- so I don't have enough data to make that prediction.  But I think it's at least a possibility that the housing market once again does the exact opposite of what "everyone" is expecting.  If it were to play out this way, I still wouldn't expect a housing "crash," but a significant rise in supply brought on by lower rates could at least turn this into a buyer's market.  Again, not a prediction, just a random thought.

Not much to add beyond that.  Trade safe.

Friday, December 15, 2023

BKX and NYA: Lessons from the Trenches

Since last update, Powell came out and signaled that the Fed is not only ready to back away from ongoing rate hikes, but that there could be three rate cuts in 2024.  The market loved hearing this, of course, and rallied on the continued assumption that inflation is literally the only problem that was ever, or will ever be, on the horizon.

But to me, that's not the most interesting thing that happened.  The most interesting thing is the resolution of an extremely complex chart pattern.  I'll admit, while I saw the potential for a version of this in advance, I didn't foresee this version of it.  

The pattern in question is shown on the NYA chart below:


This pattern hit me right in an Achilles heel, because I simply assumed in advance that if it was going to play out as a flat, then it would be an expanded flat (meaning it would head below the blue A wave before any big rally) and not the running flat that it was.  Running flats stall without breaking the prior A wave low, and because they're quite rare, it's generally silly to "assume" running flat.  So when NYA formed an impulse down that failed to break the A-wave low, I subconsciously wrote off the expanded flat option I'd been watching, entirely skipped the running flat option, and instead assumed the heavy-odds-on-favorite:  That it was wave 1 down.  

I didn't really think about this -- when you hear hoofbeats, you think horses and not zebras.  "Zebras!" probably doesn't even enter your mind.

But this time, it was indeed zebras.  

Which is part of why this type of pattern is extremely difficult to navigate in real time, and the market got one over on me here.  Even after more than two decades, there are always more lessons from the market.

Anyway, lesson learned; I won't make that same mistake again.

BKX is interesting as well, inasmuch as it appears to be forming a classic "double-retrace" of the prior extended fifth wave.  


On the BKX chart above, do note that the blue horizontal has been on that chart for over a year for a reason, and has at least the potential to be a resistance zone, near-term or otherwise.

Not much to add beyond that.  Trade safe.

Wednesday, December 13, 2023

TLT and SPX: Time to Update the Bull Count from 6 Months Ago

Back in June, I published the following bull count, which was roundly ignored, so I figure now's as good a time as any to check in on it and update it:


Let's also not forget that SPX still has this long-term overhead trend line to contend with:


Finally, TLT has continued bouncing after hitting the noted support zone:


Not much else to add.  SPX has managed to rally above horizontal resistance at the prior 4607 high, so we'll see if bulls can hold that.  Trade safe.

Monday, December 11, 2023

SPX and BKX: Caveat Subscriptor

There are two major aspects to what I present through these updates:

One aspect is the technical side of things, typically in the form of Elliott Wave counts, which are based on a combination of concrete patterns and gut instinct, in which I (almost) always present both sides of the trade.  The other aspect is something readers always seem to want (often even when I haven't offered it), which amounts to "okay, but which way are you leaning?"  That aspect is typically based on a combination of technicals, fundamentals, and, of course, gut instinct.

None of it is foolproof, but let's examine a recent case in point, because it illustrates the conundrum well.  For months leading into the recent swing low, my charts pointed to that price zone, often with the label "3/C" (or "C/3," same thing).  That was my technical (mixed with some gut instinct) read on where we were headed for the immediate future.  In Elliott Wave, a C-wave always represents three down (or up), which is always an inflection zone -- though in this instance, I further mentioned that my lean was that we'd go on to form five down.  That lean was based largely on the seemingly-awful fundamentals that the market faces, but that lean turned out to be in error.

What was not in error was the location of the inflection zone (SPX 4090-4115; in fact, the market nailed it dead-center).  It's just that many of us (including me) thought that wasn't going to be the end of it.  As I wrote on October 26 (in an update appropriately titled:  Now Entering "Bounce or Break" Territory):

Yesterday, SPX came within 7 points of its preferred target zone, which also puts it into the C-wave inflection zone (not that I'm expecting this to be a C-wave, but I'm not always right, so I never ignore things that run counter to my biases):

That was followed by this chart: 


So on the one hand, the technical aspect worked flawlessly in this case -- but my lean that we'd go on to form an impulse did not.  It's important to understand the difference between those two things -- my lean is always an xx% vs. xx% proposition; it is NEVER, EVER 100% vs 0%.  Never.  Usually pretty far from it, as it's usually 5x% vs. 4x% (i.e.- 53% to 47% or similar).  

Even the technical aspect isn't 100%.  (Nothing I believe about anything is 100%, for that matter, at least as far as I'm concerned.)  I feel like I've made that pretty clear over the years, but in case I haven't, there it is again.

In this instance, I probably needed to focus more on the warnings and caveats for bears.  I covered them a few times, but probably didn't highlight them enough.  

Below, I intentionally left the labels on this chart as they were -- next update I'll delete the 1/2/3, since we know now that it was the A/B/C portion of those labels.


Anyway, I'll try to caveat more in the future.  Usually I'm pretty good about that, but I don't think I did it enough at this last inflection.

Beyond that, I really don't have a lot to add here about the current market -- I'm still awaiting an impulsive turn, as I have since I wrote about that publicly on November 8 (we had one quick little false alarm since then, but after it shook out, it was back to waiting).  Until then, there's not much for bears to sink their teeth into, and the market could run higher in the meantime.  As mentioned last update, BKX (and many other markets) has/have reached resistance, but that doesn't mean the market won't break through it:


Trade safe.

Friday, December 8, 2023

BKX, NYA, COMPQ, etc. Updates: Vive la Résistance

The market continues its sideways grind, so not much to add overall, but I do want to note that BKX, too, has now reached resistance, just overhead:


So it joins NYA, which hit resistance a little earlier (as mentioned previously):


And COMPQ:


And, of course, INDU (also noted previously) and SPX (no new chart needed), which is in the resistance zone of the prior high (also noted previously).  So, we'll see if resistance resists or not, but most major markets seem to have reached it together (in some cases, it's a little higher than the market's current prices).  Trade safe.

Wednesday, December 6, 2023

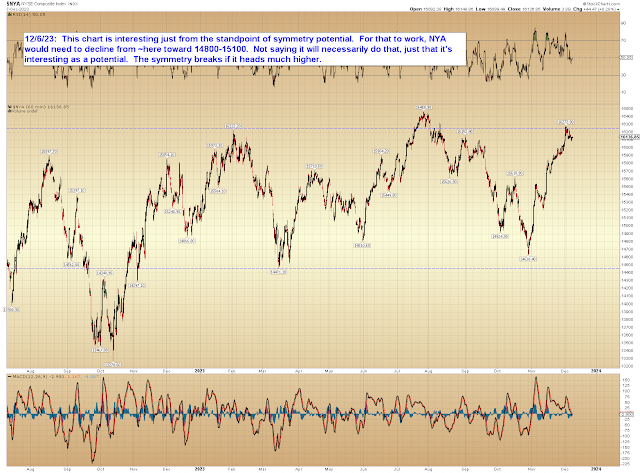
SPX and NYA Updates

The market has traded sideways for a week, so there's not a lot to add to recent updates.  I realize that it's fashionable to be bullish now, so I've drawn up a bull chart for sake of reference.   


Again, as I've discussed previously, I think if that bull count does show up and give us a new ATH, it probably doesn't get too much further than that, because the option of this rally to be the first subdivision of a new massive bull wave just seems silly to me.  But hey, maybe I'm wrong.  Here's the chart I published on Dec 1, discussing this:


Of course, everyone seems to be presuming that a new ATH is just a given in SPX, and while I agree it's possible, I don't think it's automatic.  In the event it doesn't materialize for bulls, here's an interesting chart to watch for as long as it's relevant (it could always become irrelevant by the end of today's session -- or not):


In conclusion, I continue to maintain that in the big picture, while it's entirely possible I was a wave early, I don't see many positive developments coming down the pike (to the contrary, pending Treasury supply alone is going to suck a ton of liquidity out of the market), which is probably what I'd need to see to convince me I was way off.  I'm open to change if the playing field changes materially -- but so far, it hasn't.  Trade safe.

Monday, December 4, 2023

INDU Update: Blast from the Past

Remember when (28 minutes ago) everyone was talking about the yield curve inversion?  I'm sure you do, but just in case you're new to the markets:  An inverted yield curve has accurately foreshadowed all 10 recessions since 1955, per the Federal Reserve Bank of San Francisco, with only one false positive in the mid-1960s.  


So, is "this time" really different?  Will this be the first outlier in ~60 years, proving all those who heeded history wrong?  

Or is the market/economy (yes, I very much realize those are two separate entities, despite the slash mark, and have written about that extensively) just biding its time?

INDU is approaching an interesting very-long-term trend line:


Here it is zoomed in:


And here's an even closer look, along with a trend line that's only months-old (in blue) instead of decades-old:


I suppose if we get into a bigger bull move, then it's entirely possible we're experiencing a "bull market in short covering."  Since most everyone who hasn't been hiding under a rock during the past year and a half knew about the yield curve inversion (along with many of the other fundamental challenges facing the market), maybe there were just too many shorts for bears to get traction.  Maybe those needed to be cleared out.  Maybe even more clearing out is necessary.  

We'll see if the market responds to this resistance, or if it blows through it.  Trade safe.