Amazon

Sunday, November 12, 2023

SPX and NYA: You Are Here

On Friday, SPX made a new high for the move, putting it smack at the blue ii/4 label.  We have an interesting situation now.  By all rights, this should be an inflection zone (the zone stretches a little higher), so this is going to be the first real test of this rally.  

I say that because, while many folks look primarily at indicators (which are often derivatives of price) -- and I agree those can be useful at times -- my philosophy has always been that price trumps everything.  And since the current SPX price is not unexpected (as indicated by the label being there before the market was!  In fact, one could say this price was largely "expected"), now we have to see if and how the market reacts to this zone.  That will give us further information.  

So, while I'm open to larger bull options here, the market is still operating within the tolerances of "bear" price territory.


Next, it's interesting that NYA (representative of the broader market) is still below its high from roughly a week ago, so the broad market is not participating to the same extent so far.


In conclusion, there have thus far been no big surprises for a while -- the market declined to where it was supposed to, then rallied after capturing its target.  That was all expected (though the rally did exceed the expectations I had back before we even started rallying, I immediately adjusted those expectations when they were met) -- actually, before we close this, let's take a quick stroll down memory lane:

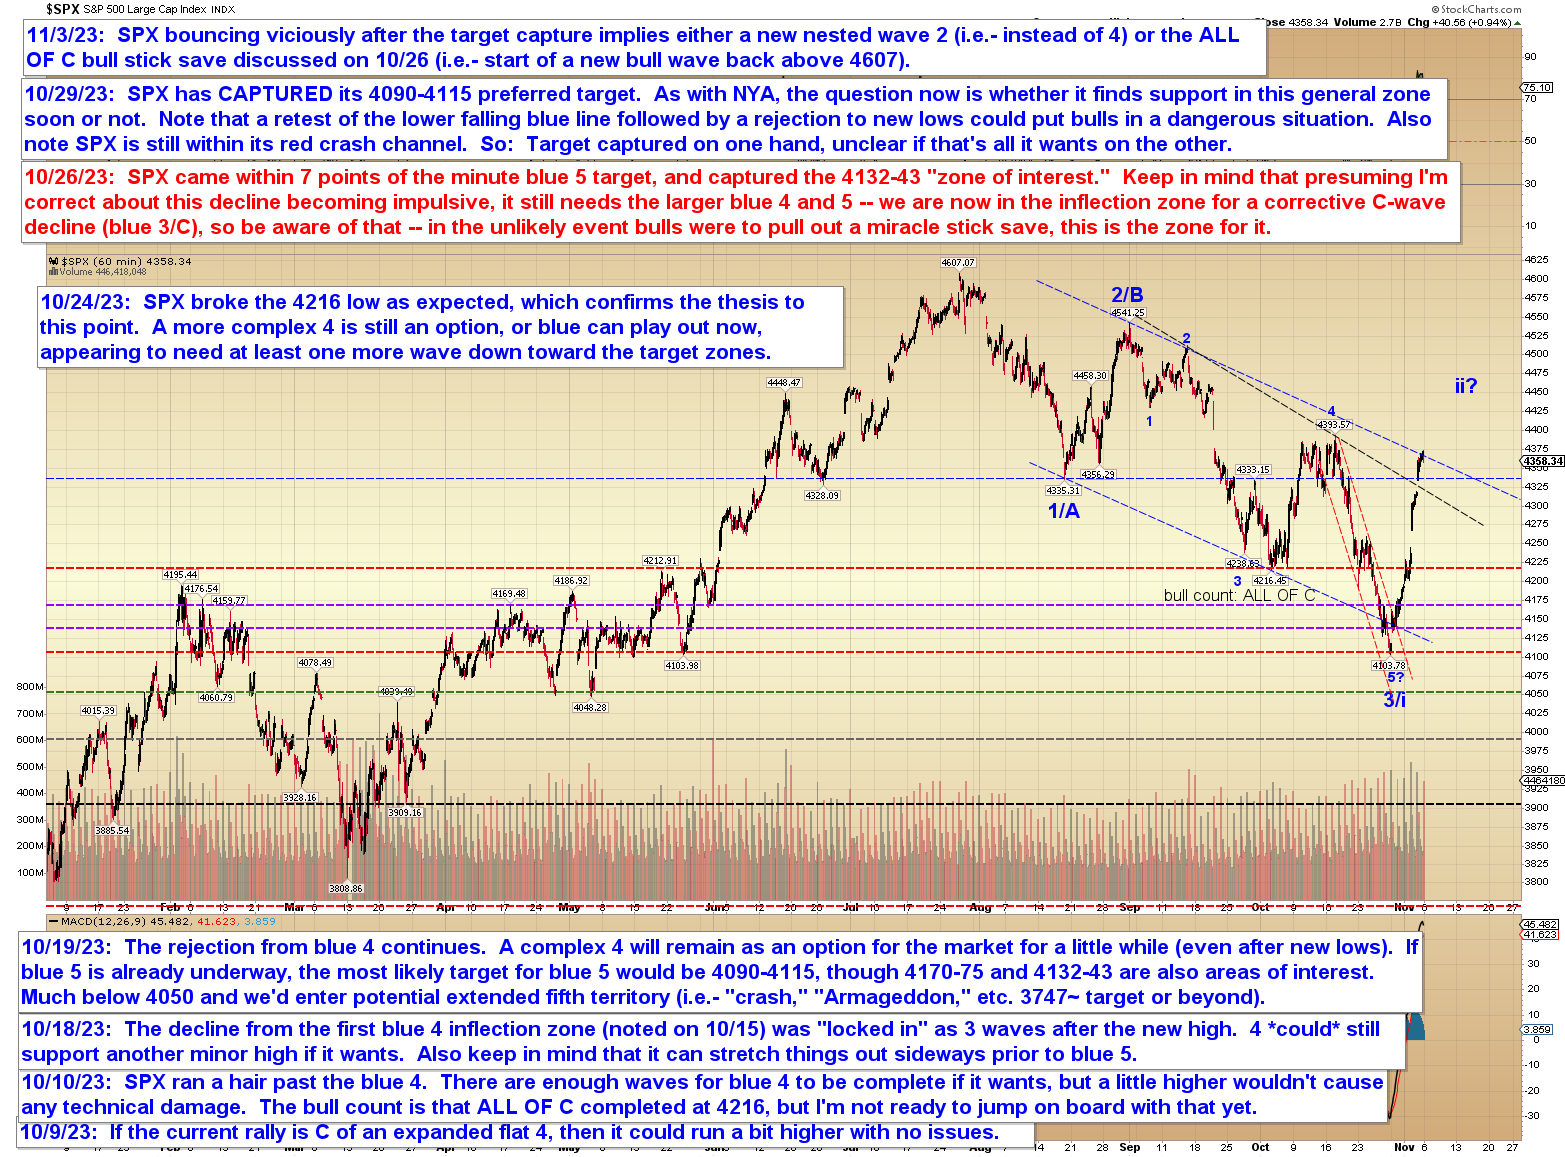
While we (myself and my readers) were looking lower (big picture -- near term, we had some upside target captures) for a while before September 22, I had mainly been painting that in broad strokes, and I think that was the first day I published the "official" exact target of 4090-4115 SPX.  Which was 300 points lower than SPX:


SPX had just about reached that target by late October, so I began warning both verbally and visually.  At that point, the visual warning "only" indicated a bounce to ~4340 (~240 points up from the downside target zone -- ~540 points total in both directions now).


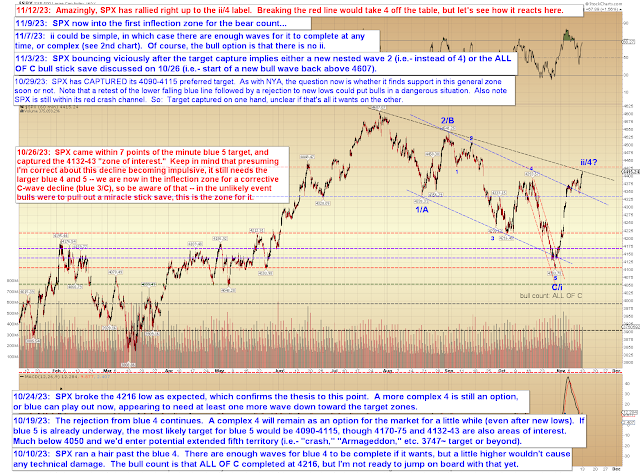
Then, as SPX reached that upside target, it became apparent it was heading higher, and I changed the label to "ii?" (added the "/4?" two updates later) and raised it to its current zone:


And that's where we find ourselves today.  So maybe I'm "due" to be wrong (because I am still leaning toward bears, though not in a "bet the farm" sort of way at this point -- we don't even have an impulse down yet!) and this rally will smash records and we'll all live happily ever after.  But I do want to see how it behaves here first.  Trade safe.

Thursday, November 9, 2023

SPX, NYA, OIL: What Did Powell Say? We May Never Know

Yesterday, Chairmanpersonguy (apologies to those who are offended by "gendered" language; the proper gender-neutral term is "chairmanpersonguypeople" but it's too long to type all the time) Powell spoke and, while I have no idea what he said (I didn't listen and don't feel like looking it up right now), the market clearly didn't like it.  I like to imagine that he harshly scolded the market for being out of touch with reality, but it's probably more likely that he simply mumbled "tools" a whole bunch of times before belching loudly and without apology, and then spun on his heel and left without taking questions.

No change from the past few updates, but a few interesting charts worth looking at, starting with the very long term SPX chart:


Next is the near-term SPX chart.  SPX is into the lower edge of the first inflection zone for these counts, so a reversal is possible (not guaranteed) anytime in here.


IT, my broad-strokes view is unchanged for now:


Next, NYA rallied straight up to the price zone where I'd originally drawn red 2, though decidedly faster than drawn.  If it were to become a two-legged rally, that would stretch it sideways/up and add more time to the pattern (but again, this is "easy as cake" territory, so that's not for certain either and an immediate end isn't impossible):


Finally, oil is getting into the general ballpark of three waves down after being rejected at the ~8 month-old red b-wave label, which proved to be both a strong magnet and strong resistance.  It's uncertain if the drop in oil wants to become five down or not, but if not, this is the upper edge of the general zone where a bounce could begin:


In conclusion, no change from recent updates, but the market is now flirting with the first bear inflection zone, so it will be interesting to see what happens from here.  Trade safe.

p.s.- okay, I finally looked it up so you don't have to and Powell was hawkish in his speech yesterday.  So, I wasn't far off in one of my guesses about his speech, though I'm still not sure which one.

Wednesday, November 8, 2023

SPX Update: "Easy as Cake"

SPX rallied a bit more since last update, which is no surprise, but it occurred to me that it might be helpful to spell out the options with a bit more clarity.  I've been doing this so long that I sometimes forget to convey information that I take for granted.  So let's focus on that today.

The two main options from here are:

1.  For bulls:  ALL OF C completed at 4103 SPX and it's on to new highs (north of 4607).
2.  For bears:  The recent decline was a nested first wave and the current bounce is a nested second wave.  In full disclosure, the argument against this version of events is that the prior wave extended 1.618 times the A/1 wave, which is common behavior for C waves, not as common for nested first waves.  The arguments in favor are more fundamental than technical.

The bull option is straightforward, so there's no need to discuss it further.  

The bear option breaks down into a couple of suboptions, which I've attempted to roughly sketch (don't hold me to these, because where we are is not this predictable) on the following two charts. 

Bear suboption 1 is simply "run it up as fast as we can, then run out of gas like an unsuccessful test rocket":


Bear suboption 2 is to drag things out for a while by forming a two-legged bounce:


So bears should keep in mind that even if everything goes their way, the market can always grind along for a while, and could even give bulls something akin to a false Santa Rally.

I also wanted to quickly update the TLT chart.  My warning from October 23 proved quite timely:


In conclusion, there's no quick and easy roadmap in the current position, so we'll just have to watch for potential impulsive declines in real-time and take it from there.  Waiting for impulsive turns can sometimes help bears stay out of trouble in the event the "straightfoward bull count" shows up, since that approach prevents one from shorting the entire ride up to new highs.  It also gives one a clear stop (against the high where the (pending) first impulse down began), as opposed to the current situation, where the only crystal-clear level is way up at 4607.  None of that is trading advice.  Trade safe.  

Monday, November 6, 2023

SPX Update: A Zweig Breadth Thrust Indicator?

On Friday, the market continued rallying.  Several members of the forum pointed out that this triggered a Zweig Breadth Thrust Indicator, which is a rare signal that's triggered when the market thrusts its breath so forcefully that it wheezes, which makes a noise that sounds like "Zweeeeeig!" That wheeze is a buy signal.  (Or something like that.)

Investopedia defines it slightly differently, stating:

"The Zweig Breadth Thrust Indicator is a calculation that measures the swiftness of market sentiment shifts. It was developed by American stock investor and financial analyst Martin Zweig. The calculation is based on the ratio of advancing stocks to the total number of stocks. It is calculated by dividing the 10-day moving average of the number of advancing stocks by the total number of stocks. The indicator is used to identify major shifts in the primary trend."

Of note, that piece wasn't written over the weekend, but was published April 12, the last time the market triggered this exact same buy signal.  Which was of course in the wake of the "Banking Crisis Averted! (for now)" action from the Fed, which suggests the signal can be triggered by short-covering rallies that shift sentiment.

As I noted on the forum, one thing worth noting is that the forward P/E ratio of the SPX is currently 18.62, which isn't exactly low, and which suggests that if the market were to turn into a new bull from here, that would not be based on fundamentals, but would instead be a new bubble.  Which isn't unheard of, obviously, we've had plenty of bubbles in the past -- but which may be a stumbling block for the Zweig Breadth Thrust Indicator, as the only other time it triggered with the forward P/E ratio this high was -- you guessed it -- back in April of this year.

So, maybe it's a good signal and we'll be marveling at it a few months from now -- but unlike many of the previous successful signals throughout history, this one seems to lack fundamental support.

Anyway, just one chart today, where I updated the labeling to match the annotation from the prior update.  Note that SPX hit the blue resistance line on Friday, so that's its next hurdle.


Not much to add beyond that.  Trade safe.

Friday, November 3, 2023

SPX Update: Finally Bouncing from Target/Inflection Zone

Apparently it was "that simple" as SPX finally committed to bouncing solidly after capturing its downside target and inflection zone.  In fact, the bounce is now close to wave 1/4 overlap territory, which would suggest the bounce is either another 2nd wave or the ALL OF C bull option discussed on 10/26:


Next resistance is fast approaching (blue rising line), so we'll see if that zone can slow the bounce or not:


Not much to add beyond that.  Trade safe.

Tuesday, October 31, 2023

SPX and NYA Updates: Five Nights of Fed-days, Starring Jerome "the Gnome" Powell

Not much to add to the past few updates.  SPX and NYA have both continued to bounce from their target/inflection zones.  A day late for Halloween, but today is still a Fed day nevertheless, and how the market reacts will probably determine whether a higher-degree bounce plays out now or not.

SPX:


NYA has rallied to the lower end of the blue circle:


In conclusion, nothing really to add.  Trade safe.

Monday, October 30, 2023

SPX Captures Its Target: Let's Discuss This in More Detail

On Friday, SPX captured its preferred target zone for Wave 5 of 3/C, so it's entirely free to bounce in a decent reaction rally now.  But -- just in case -- because we're into potential "crash window" territory (not something I say often), today we're also going to discuss some of the "But what if it's not that simple?" options.

Let's start with NYA, which has behaved like a champ (at least, if one has been following the ongoing targets and wave counts listed in these updates, it has):


Next, we'll look at SPX:


On the NYA chart, I mentioned the option of "just a LITTLE lower," and this is because nailing down the exact end of fifth waves isn't always as simple as "well, it captured the target, we can all go home."  So, there's an in-between option that isn't as dramatic as the fifth wave extension, but that still delays bulls from any warm and fuzzies yet.  The chart below discusses one such potential:


COMPQ hasn't quite invalidated the diagonal from a technical standpoint, but I ultimately continue to favor the bears, as I have for the past few months.

[Note:  Typo.  "~13520" should instead read "~12520."]


Finally, the SPX "roadmap" chart continues to track well, and time and price have again collided to keep SPX riding right along the blue line:


On the chart above, it's worth a brief mention that SPX has not quite overlapped the a/1 high, which sits at 4101.  Overlap there is going to take some of the wind out of bulls' sails, and I would expect once it happens, the previously bullish Elliotticians will get on the bear bus (unless they're hopeless permabulls) -- if they haven't already done so with the overlap at blue b (which is where most of them probably think the wave 1 peak is).  This will be annoying, because I hate when everyone agrees with me, especially when it comes to trading.  But it's a necessary evil, I suppose, though it may lead to the market throwing some kind of curveball to try to shake everyone again.  

I mention this because it's one of the reasons I've been considering the possibility of an extended fifth:  An extended fifth wouldn't allow latecomers on board, and it would keep bulls trapped.  So those who have only recently woken up to the possibility that the market is in a high-degree third wave won't be able to profit from it.  In fact, they will most likely lose money, even with their newfound knowledge, because there's a strange tendency traders have where if they aren't short heading into a steep drop (such as we just had), they will start bottom hunting and buying way too early.  Not because they're necessarily bullish, but mainly because they aren't short and they're trying to get in on the action.  Or they're trying to recover the losses from their stopped-out longs.

So, if you put it all together, there's some psychological impetus for the market to just keep dropping here.  Extended fifths are brutal, some of the worst waves one can encounter because they move very quickly and only come up for air long enough to grab a few stops (on the shorts) and sucker a few bulls -- then they resume their relentless waterfall.  They don't bounce hard until they're entirely done (then they bounce fast and brutal, your textbook V-bottom massive "short covering rally" -- which then, after it has stopped all the shorts and lost money for everyone who shorted the hole, retraces and becomes more of a W-bottom to shake the late buyers before bouncing even harder).

Anyway, we'll see how it plays here.  The short version is this:

  1. SPX has captured its Wave 5 target and does not need to go any lower.  It could form a decent bounce from here (plus or minus a little).  If one has been following these updates, then one already has hundreds of points of profit and may not feel the need to get overly greedy (not trading advice).  Maybe it's that simple.
  2. Wave 5 still has the option to extend/waterfall if it wants.
  3. There's an in-between option that keeps everyone guessing for a while and which could also satisfy the "burn the former bulls who are now buying too early" scenario discussed at length above.
  4. In options 2 and 3, there could be a short-lived bounce toward one of the noted resistance/inflection zones before the downtrend resumes.
That's about all I've got for today.  Trade safe.