Amazon

Friday, October 27, 2023

TRAN, SPX, COMPQ: Now Entering "Bounce or Break" Territory

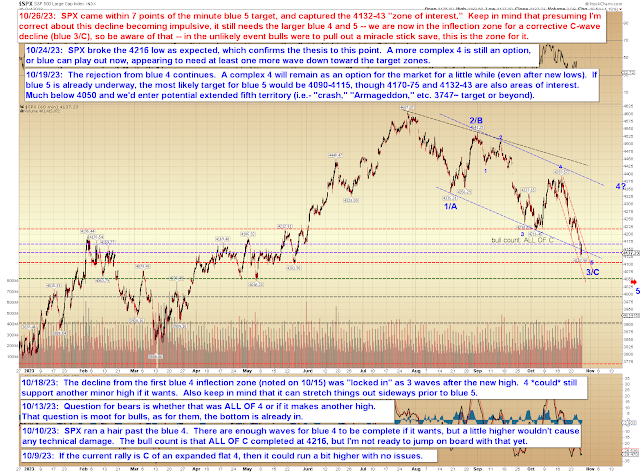
Where to start today?  Let's start with the near-term SPX chart.  Yesterday, SPX came within 7 points of its preferred target zone, which also puts it into the C-wave inflection zone (not that I'm expecting this to be a C-wave, but I'm not always right, so I never ignore things that run counter to my biases):


Returning to my bear bias at the moment:  Keep in mind that we cannot yet rule out a fifth wave extension -- so this is a little bit tricky, in the sense that we're into "bounce or break" territory.  A normal fifth could bounce soon, where an extended fifth will waterfall.  My approach at such times is to pay closer attention to near-term trend channels and at least keep a few runners short until such time as the market breaks out of its crash channel.  The red channel on the chart above is an example of a crash channel.  This approach doesn't guarantee anything, but it does at least sometimes keep one from missing any sudden "whooshes" lower.  None of this is trading advice, of course.

The reason I mention runners (as opposed to stubbornly refusing to take any profits at all) is because most of the time, fifth waves end in the ballpark of where they're "supposed" to.


Next up, let's look at a TRAN chart I drew exactly one year and 8 months ago, published in a piece titled As in December, I Remain "Long-Term Bearish Until Proven Otherwise":


We can see in the updated chart (below) that 2/B moved a hair faster than originally drawn, but the price placement of 1/A and 2/B were both pretty decent -- especially considering that insisting the market was entering a long-term bear market back in February 2022 was widely considered ridiculous at the time:


When we look at TRAN's chart above, it doesn't take a master's degree in Elliott Wave to recognize what appears to be a pretty clear 3-wave rally.  Could it be something weird, such as an expanded flat?  Sure.  But that's fairly unlikely.  It's more likely to be exactly what it appears to be, and that bodes really poorly for the broader market, because TRAN is a leading indicator for both the stock market and the economy.  TRAN companies are involved in the business of moving goods and people around the country and around the world -- and an economy moving fewer and fewer goods/people is an economy in contraction.  

This is true regardless of what the "spreadsheet economy" guys keep saying.  (You know the ones I mean.  They love to say things such as, "Why are people so depressed about the economy?  GDP was GREAT and unemployment was GREAT and yada yada!"  These folks are apparently so far removed from the real world that they think everyone exists only inside their spreadsheets as an easily-comprehended digit, so they can't understand why actual humans who are struggling to feed their families might feel differently.)

Next is a quick update to a very-long-term SPX chart:


Finally, COMPQ seems to echo the "bounce or break" theme of the fifth wave (or potential extension thereof):


In conclusion, nothing has changed from the past few weeks of updates, but we are finally in the ballpark of where a smaller fifth wave could complete and trigger a decent bounce (which, given that it's expected to be a larger fourth wave, could turn into a sideways grind that burns some time).  In the event bulls can't muster a bigger bounce here (meaning the approaching target zones), we could fall directly into a fifth wave extension, do not pass Go, do not collect $22,867.  (Inflation.)  Trade safe.

Tuesday, October 24, 2023

SPX, NYA, COMPQ: Bears Still Getting Things Done

Since last update, my "against the crowd" lean that The Rally Everyone Was Getting Excited About was nothing more than a corrective fourth wave proved out:


SPX isn't tracking my September roadmap perfectly, but it's tracking it well enough.  For now, I've left everything as it was originally drawn:


SPX over the near-term is a bit unclear -- even under the most bearish scenario, SPX could head lower early, then reverse back up to/beyond yesterday's high to complete a micro 4th wave.  Or it could just enter the micro 5th (down) directly if it chooses.  As noted, it's not terribly clear on the one-minute chart which option it wants.  I'd probably very slightly lean toward the bounce, but waves can get weird if the market is in bad shape, so neither outcome would surprise me.

Oh, and of course that bounce could end up being the start of the bigger complex blue 4 from the first chart, probably shouldn't entirely ignore that.

NYA's chart describes how it could work with the big complex 4 in SPX, were such a thing to occur:


Meanwhile, COMPQ is in "bounce soon or break spectacularly" territory:


In conclusion, no real change from the last few months of updates, other than to note that things are progressing as well as bears could have hoped.  Trade safe.

Sunday, October 22, 2023

SPX, COMPQ, Gold: Friday's Update was a Hit

Friday's update concluded with:

Incidentally, if today begins with a little bounce back up over 76, then there's a reasonable chance that the overnight low is a corrective b-wave -- meaning the overnight futures low would be revisited and broken soon after (the overnight low sits down near ~4253 cash equivalent, though this isn't an exact equivalent, so allow a little leeway).

Friday's market found support 3 minutes after the open and bounced up to 76.56, then reversed and dropped below 4253, fulfilling the prediction quoted above.  It eventually dropped all the way down to 4223 near the close, so hopefully that was helpful to readers.

Friday's close is into the zone that constitutes a retest of the prior swing low ("retests" are never to the penny and are plus/minus zones above and below prior lows (or highs)), so we'll see if bulls can muster any sort of bounce from this zone.  Keep in mind that the complex 4th wave discussed previously stays on the table plus and minus the current zone:


COMPQ is also testing its low:


I did want to mention that Gold did not sustain a breakdown at its key trend line, and as long as that continues, it will avoid the option of the blue path.  The next step for gold bulls would be to attempt to decisively clear the zone around the last three highs.


Finally, the very-long-term chart of SPX remains interesting:


In conclusion, the market traveled, without incident, from the blue 4 inflection all the way down to the zone where it will enter the upper portion of the inflection for a more complex blue 4.  I'm not crazy about the idea of a complex fourth, because I think it's too easy on bulls, who ideally should be trapped now -- but it's always possible.  How the market behaves over the next week or so may determine if November 2023 becomes known as "Black November" in the future; if it goes directly into a fifth wave, there is potential here for an extended fifth (extended fifths become waterfalls).  Trade safe.

Friday, October 20, 2023

SPX, NYA, COMPQ, TLT: On the Right Track

Yesterday no doubt came as a surprise to people who don't read these updates, as SPX continued lower from Blue 4, ultimately dropping through a level that many bulls thought was going to act as strong support. 

Let's look at the SPX chart first, which (spoiler alert) mentions the primary target for Wave 5 (if blue Wave 4 doesn't become more complex, and if blue 5 neither extends nor truncates), which, coincidentally enough, aligns right with the location where I previously placed the Wave 5 label, along with some other zones of interest:


Next up is NYA:


Next is INDU:


COMPQ (nothing new here):


And finally, TLT is reaching a zone that probably needs to act as support.  Funny thing is, this is a falling support zone, so it could always bounce along down this zone like a slinky (if slinkies bounced, that is.  You know what I mean!).  So even if it finds support at this zone, it doesn't necessarily mean a big rally.  Some part of me thinks 75 +/- looks like an aesthetically-pleasing next target, but don't hold me to that.


In conclusion, not much to add to the past few updates, which means the last few updates were on the right track and the market's done nothing but add confidence to my bearish lean.  Incidentally, if today begins with a little bounce back up over 76, then there's a reasonable chance that the overnight low is a corrective b-wave -- meaning the overnight futures low would be revisited and broken soon after (the overnight low sits down near ~4253 cash equivalent, though this isn't an exact equivalent, so allow a little leeway).  Trade safe.

Wednesday, October 18, 2023

SPX and INDU: Blue Velvet

I believe it was Jon Keynard Maynes (distant cousin of the more famous "John Maynard Keynes") who once said, after a few beers, "The market can remain insolvent longer than you can remain rational."  (Although some reports suggest he may have said, "I'm not gonna drink none of yer important... imported... GAH-rbage.  Pabst! Blue! Ribbon!")  

Whichever quote is accurate, he no doubt meant it.

And I bring this up today as a simple, yet poignant, reminder that drinking and speaking don't mix.  (Support MADSMofos Against Drunk Speaking.)  

And also as a reminder that even if everything goes swimmingly for the bears from here forward in terms of them getting the exact wave count they want, the market can always still grind sideways before getting rolling.  Not that I'm predicting this, mind you, any more than Jon Keynard Maynes was predicting the rise and fall of Pabst Blue Ribbon -- it's just a word of caution that the market sometimes doesn't move in straight lines.

SPX made another slight high since last update, and while there are potentially enough waves for a complete 4, it's as yet unclear if it still wants one more minor high (as we'll see on the INDU chart after this one):


INDU:


In conclusion, the early stages after an ambiguous pattern are always touch and go, as the pattern leading in provides little confidence one way or the other, at least until we see a bit more of the decline.  I can say that the first wave down from yesterday's high appeared impulsive, suggesting at least one more wave down of similar or larger size -- but whether that will terminate the decline at "3 down" and make another high after, or whether we just saw the start of the turn down to new lows, I cannot yet say with high confidence.  Trade safe.

Monday, October 16, 2023

SPX, INDU, COMPQ: Legacy Charts and a Horn Toot

So I've been holding my tongue on this, but it's time to toot my own horn for a minute on a prediction I made almost exactly a year and a half ago, because it probably won't hold forever.  This prediction was based on my analysis of the real estate market back in April of 2022.  As far as I know, I was the first analyst to make this very specific prediction... key here is "as far as I know.  It's entirely possible someone else beat me to it, but if they did, I don't know about it -- what I recall at the time was that many people were predicting a precipitous drop (or an outright crash) in housing as interest rates rose.  Which obviously didn't happen, in large part for the exact reasons that I highlighted on April 18, 2022.  As I wrote then:

This means that as the music stops and mortgage rates rise, we have a much different dynamic in play this time. Rising rates do, of course, have an impact on future affordability -- but they have no impact on families already in a home (presuming these families have a fixed-rate mortgage, which, as we already covered, the vast majority do). If anything, rising rates might tend to inspire people to hang on to their homes longer instead of putting them up for sale, which would have a tightening effect on inventory. After all, if you're in a mortgage at ~3%, what possible incentive do you have to ever exit that loan with inflation running above or near 8%? 

As I mentioned earlier, inflation should provide a tailwind for housing -- in more ways than one. If my reasoning above is in the right ballpark, then rising rates may, perhaps counterintuitively, provide impetus for inventory to ultimately balance. Houses might spend more days on market due to fewer buyers, but if fewer homes are being brought to market in the first place because families are incentivized to stay put (or to turn their old 3% mortgage home into a long-term rental), those seemingly-opposed forces could tend to counteract each other.

And, of course, now that my initial prediction has become reality, everyone treats it like it was obvious all along.  Below are CNBC's bullet points from a couple months ago; basically exactly what I'd speculated would happen, back in April 2022:

  • The recent spike in mortgage rates has created a so-called golden handcuff effect. 
  • Nearly 82% of homeowners feel “locked-in” by their existing low-rate mortgage, according to data from Realtor.com. 
  • In the meantime, the shortage of homes for sale is pushing up prices.
So, anyway, I just had to get that off my chest.  I see it everywhere now and I see this "Well of COURSE that's what happened!" attitude from pundits and analysts who didn't foresee this coming at all, so I'm publishing this in lieu of cussing at my screen.

Anyway, market-wise, we have some interesting things to look at today.  Let's start with an old legacy chart I first published years ago, whose trend lines seem to find their way back to relevance again and again:


Next, we have another old legacy chart with a long-term support line:


Next, COMPQ:


SPX and the old (not nearly as old as the first two charts, of course) green trend line:


SPX is still undefined regarding the potential 4th wave:


And finally, the two most obvious very-near-term options:


Worth noting that in the event of sustained trade below Friday's low, and 4270-90 SPX would be the next meaningful support zone.  Trade safe.


Friday, October 13, 2023

SPX Update: Not Much to Add

There's nothing to add to the past few updates, so just one chart today:


In conclusion, not much else to say yet that hasn't already been said.  Trade safe.