Amazon

Wednesday, February 1, 2023

SPX Update: "__ _____"

Today is a Fed day, which at least (likely) means that for the next update, we'll be able to talk about something other than "no material change."  I've been saying "no change!" so much lately that I'm starting to feel like I'm walking down Broadway at lunchtime, trying to placate aggressive panhandlers.

So for today's update... sorry, I only have credit cards on me, no (spare) change.

But!  I did want to call attention to the blue trend line on the chart below, in case it becomes relevant:


SPX did whipsaw the first breakout of the rising wedge, but so far has not followed through on the downside:


The intermediate view is still the same:


In conclusion, we'll likely get some resolution soon, courtesy of the Federal Reserve.  Trade safe.

Monday, January 30, 2023

SPX Update: Nothing to Add

Nothing to add to last update, so please refer back to that if needed:


Trade safe.

Thursday, January 26, 2023

SPX Update: A Refresher, and a Look at the Near-term

Over the past couple months, we've witnessed the market turn down at the blue 2 inflection zone, then turn up at the next downside inflection zone (which was the inflection zone for a corrective ABC expanded flat decline), then turn down yet again at the next inflection zone (which was/is the inflection zone in the event the low was not the aforementioned expanded flat)... and SPX has since rallied back up to test that last inflection again, which is where it sits as of the time of this writing.

There's really no change to anything I've written for the past several months, but I wanted to again drill down a bit into the details to refresh everyone's memories.  

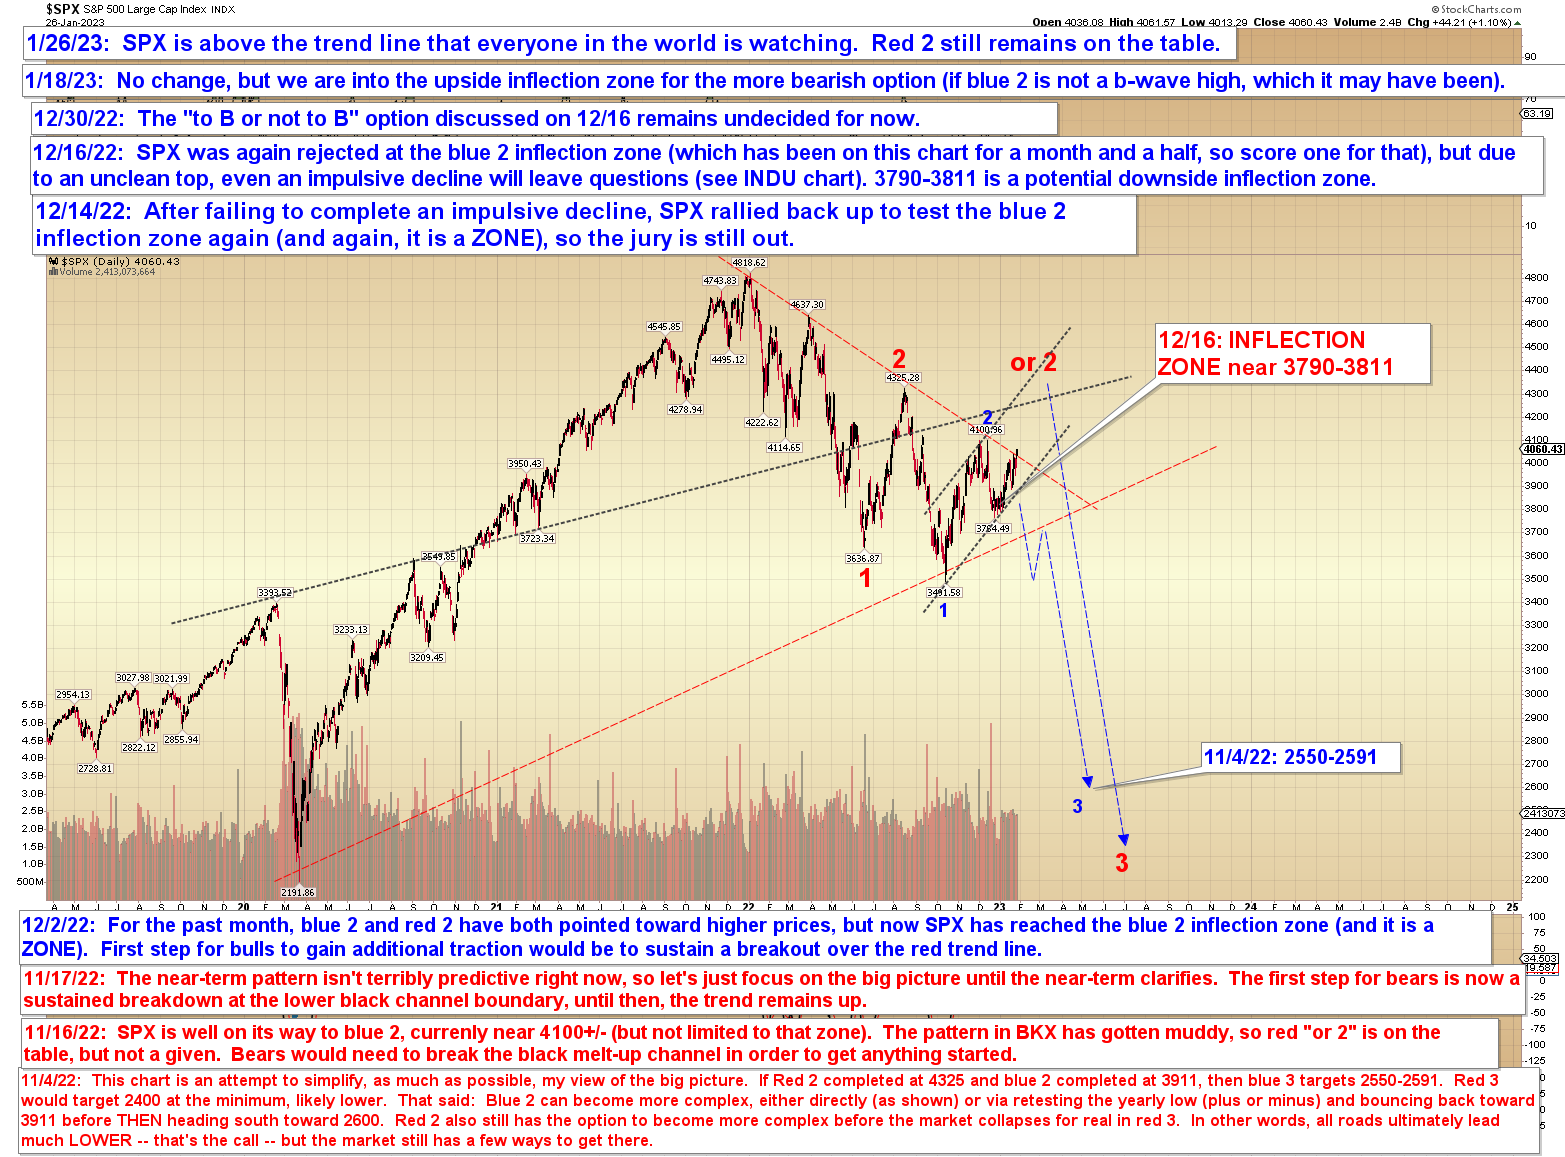
The bigger picture chart previously pointed higher toward either blue 2 or red 2.  We reached blue 2, and the market reversed -- but right from the start, we were immediately cautious about that reversal, for reasons I discussed on December 16 (and several times since):

SPX was again rejected smack at 4100, the price point I've been watching for more than a month and a half, but the market has left a less-than-clean top in its wake... the most recent tops in SPX and INDU are not ideal, leaving open the possibility of a B-wave high expanded flat pattern.

As of today, we still have yet to get any confirmation that said reversal was anything more than that previously discussed expanded flat (often referenced as "to B or not to B" in past updates).

For reference, here's the big picture chart again, with blue 2 and red 2:


Beyond that, I also want to talk about the near-term, because I've seen some interpretations of this pattern that are only looking at one side.  Over the near-term, SPX has formed a rising wedge.  Rising wedges are not necessarily bearish patterns -- they can also be "pending launch" patterns (bull nests, which are a series of first and second waves pointed higher, sometimes take the form of a rising wedge).


For the above pattern to become bearish, bears would need to whipsaw any breakouts of the upper trend line, then break and hold the lower trend line.  Until that happens, it pays to continue to consider both sides of the trade (especially given the ambiguity we observed in real-time at the 4100 high).  Blue 2 is still on the table, but we should not forget about the possibility of a trip to (or beyond) red 2.  Trade safe.

Wednesday, January 25, 2023

SPX Update

SPX is still in the noise zone for the possible blue 2 (and worth noting that blue 2 would remain technically  possible, in a slightly different iteration than shown, even if SPX broke a bit above ~4100)


Thus, there's still not much to add.  Trade safe.

Monday, January 23, 2023

SPX Update: Short and Sweet

No change since last update, or since mid-December (though, really, for longer if we refer back to the macro chart, which has been largely unchanged since early November), so I'm going to keep today's update short and sweet.  The question is still unresolved on "blue 2 vs red 2."  Worth noting that a break of the obvious falling trend line on the way to red 2, were it to occur, would go a long way toward convincing many people that the bear was over (I currently believe this would be a fake-out, though):


In conclusion, there's not much for me to say that I haven't already said in 20 ways already over the past few months, so... trade safe!

Friday, January 20, 2023

SPX Update: It's Finally Decision Time

On December 16 (and a bunch of times since), I published the following chart, suggesting that the market would decline toward the 3775 zone, find support, then reverse and rally up toward 4010, where it would encounter the next inflection zone and have a decision to make:


As it turned out, the market bottomed at 3764, then topped at 4016.  Here's how that chart looks now (I haven't updated this chart since January 11, because Stockcharts always deletes all my annotations and makes me start over, which is annoying and time consuming and it's just not worth it anymore -- the chart served its purpose):


This (along with a million other examples that long-time readers are familiar with) is why, when people on Twitter act like Elliott Wave is some sort of mystical voodoo, I usually don't even bother to argue with them anymore.  I didn't publish 5 SPX alternate counts and eventually get a hit (nor do I generally count anything but the preferred count as a "hit" anyway), I published this one chart for more than a month straight, and it was so accurate (though I did have to nudge the labels a hair, of course) that I almost could have stopped publishing on December 16 and just waited for it all to play out (don't give me any ideas!).

So, the lines seem pretty clear from here.  Bears want to hold the 4016 high, bulls want to hold the 1/A low.  Keep in mind that the most bearish count here is exceedingly bearish, because if blue 1/A is 1 (and not A, or C of an expanded flat; too early to say for sure, hence the "?" from Dec. 16), then the market is at the beginning of a nested third wave decline that's likely to become the most significant and rapid sell-off this bear market has yet seen.  Third waves are often "crash" waves.  Trade safe.


Wednesday, January 18, 2023

SPX and NYA Updates

Not much has happened since the last update and the long weekend.  NYA, as noted Friday, did break its prior high:

(note:  Typo in 1/18 annotation -- 16358 (12/5 update) is the correct target)


NYA's break does at least weakly suggest that perhaps SPX will ultimately do the same:


In conclusion, all of this was worked out a month and a half ago, and the market has finally done what it was expected to do -- so now it's just a matter of how it handles this current inflection.  So far, no signs that bears have jumped back in.  Trade safe.