Amazon

Friday, November 18, 2022

SPX Update: Keeping It Simple

Last update discussed that the market seemed to have completed several fourth waves recently and noted:  

All this implies that the market might be unwinding its upward momentum, meaning the rally might be getting a little tired. I say "might be" because this is the type of market that can easily find a second wind and burn bears who get too aggressive too early, so I'm not inclined to get too far ahead of it... but it's interesting to note that we are approaching the blue 2 zone (chart below). 

That said, it's quite possible that if there is a reversal, it will just be a correction on the way to red "or 2," so I'm awaiting an impulsive decline before actually changing footing. As of this exact instant, this is more of a "time to be cautious" moment for bulls, as opposed to a "bet the farm short" moment for bears. It could always turn into one, but we don't have an impulsive decline yet.

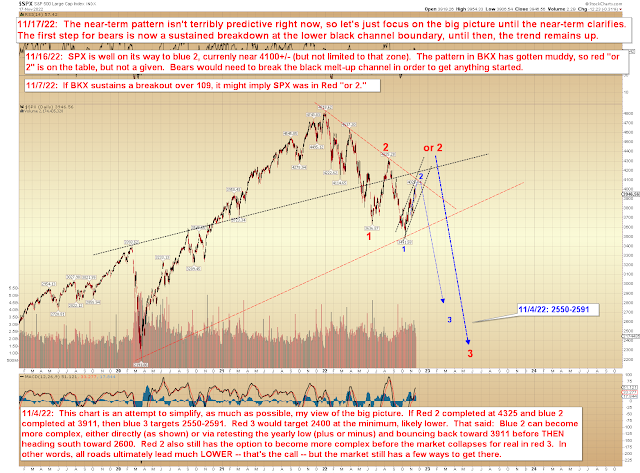
As of this instant, we still do not have an impulsive decline, and it does appear that the last dip was probably just another corrective fourth wave.  So for now, we're just going to focus on the big picture:


In conclusion, the next real test for bulls will come near the downsloping red trend line and blue 2.  Until then, bears would need to sustain a breakdown of the rising black channel to get anything started.  Trade safe.
Wednesday, November 16, 2022

SPX and BKX Update: "Easy as Cake"

 Last update predicted:

the SPX 24 hour chart (ES+SPX) appears to be three waves up into its high, which suggests that either the rally since 3941 (on that chart) is incomplete to the upside, or that the larger wave (going back to the start of the rally) is incomplete to the upside. In other words, this chart seems to suggest more upside either now or later.

And then later underscored:

let's not get too far ahead of the market yet, as the SPX24 chart (second chart) seems to suggest we're not quite to the bigger B/2 just yet

This read was quickly vindicated by the market, which made new highs later that session.  This implies that the correction discussed above was a fourth wave (at micro degree) and that the new high was a fifth wave, with another fourth seeming to play out in the latter part of the session on the 14th, with the fifth to pair with that second fourth ("second fourth" is fun language) showing up in the gap up yesterday.  We may have then seen yet another fourth wave (a "third fourth"!) manifest in the remainder of the session yesterday.

All this implies that the market might be unwinding its upward momentum, meaning the rally might be getting a little tired.  I say "might be" because this is the type of market that can easily find a second wind and burn bears who get too aggressive too early, so I'm not inclined to get too far ahead of it... but it's interesting to note that we are approaching the blue 2 zone (chart below).  

That said, it's quite possible that if there is a reversal, it will just be a correction on the way to red "or 2," so I'm awaiting an impulsive decline before actually changing footing.  As of this exact instant, this is more of a "time to be cautious" moment for bulls, as opposed to a "bet the farm short" moment for bears.  It could always turn into one, but we don't have an impulsive decline yet.


BKX, of course, decided to get cute and goofy and whipsaw its breakout, so it's not unreasonable to think it's still headed higher, and we can definitely say that "or 4" isn't a given yet:


In conclusion, SPX has spent the last few sessions lunging briefly higher, but then failing to find additional buyers, so while there's nothing yet to suggest a reversal, bulls may want to at least lean forward in their chairs a bit and watch things closely over the next couple sessions.  Trade safe.

Monday, November 14, 2022

SPX Update: Increasingly Messy Market

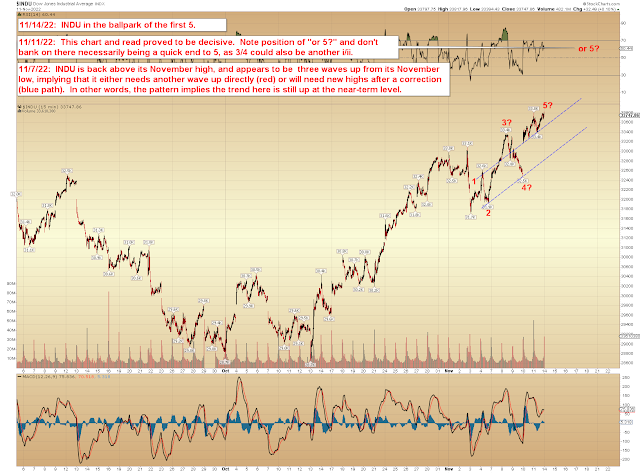
Since last update, the market continued rallying, but now INDU has reached the first "5?" on its chart:


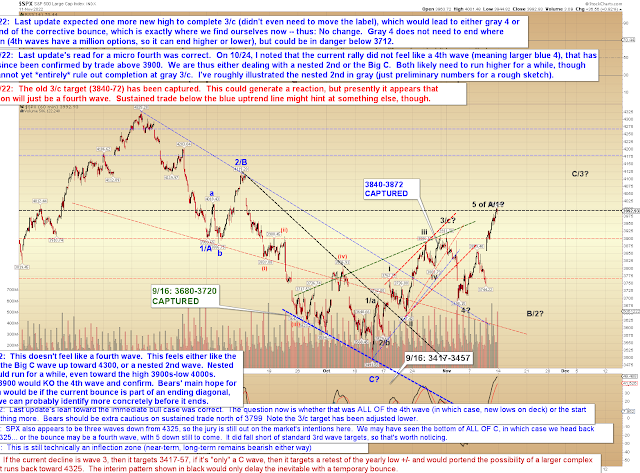
If SPX doesn't resume rallying directly, the first meaningful zone to watch for possible support is probably 3905-3925... I mention this zone because the SPX 24 hour chart (ES+SPX) appears to be three waves up into its high, which suggests that either the rally since 3941 (on that chart) is incomplete to the upside, or that the larger wave (going back to the start of the rally) is incomplete to the upside.  In other words, this chart seems to suggest more upside either now or later.


That said, this chart (below), which I haven't updated since November 2 and intentionally haven't updated today, is interesting and shows the market tagged resistance at Friday's high:


In conclusion, if SPX cannot get back above 3990 fairly quickly, it does have options for a correction toward the 3930s, then the aforementioned 3905-25 zone.  If that zone fails, there are several smaller potential support zones below it (3886-96; 3861-74; I won't list them all here), but the bigger B/2 correction shown on the old non-updated chart (final chart) would then at least be on the table, too.  However, let's not get too far ahead of the market yet, as the SPX24 chart (second chart) seems to suggest we're not quite to the bigger B/2 just yet -- though this pattern has grown increasingly messy in recent days, so we'll take it as it comes.  Trade safe.

Friday, November 11, 2022

SPX, INDU, BKX: INDU Chart FTW

Last update discussed how INDU's chart implied the market was still going to head higher one way or another, and that proved to be decisive:


BKX still hasn't sustained a breakout over 109 (it's over 109, but this breakout has not been tested yet), but it's close:


That's relevant because it would imply a bull nest in BKX, which would likewise need to see SPX rally more considerably:


In conclusion, the read of the INDU chart last update proved to be correct, now bulls are just trying to decide "how high?"  By all indications, they have plenty of room to run if they so choose.  Trade safe.

Wednesday, November 9, 2022

SPX, INDU, BKX: INDU May Offer Clues

There isn't a ton to add to the prior update, but there is one notable chart development since then, in INDU, which has already rallied back above its November high:


BKX has retested its high, but not cleared it yet:


SPX indeed found support at the noted zone:


And no change to the big picture:


In conclusion, not a lot to add to the prior update, except to note that INDU has made new highs for November, which implies it still needs more upside one way or another -- which in turn suggests that SPX and BKX may ultimately (see potential paths again) reclaim their November highs as well.  Trade safe.

Monday, November 7, 2022

SPX and BKX: Bimodal Market

Here's my conundrum:  A couple weeks ago (and since), I published several updates urging bears to be cautious (though I ended those on November 2).  The market then rallied until the Fed announcement, leaving me to wonder if that satisfied the near-term bullish instinct I had a couple weeks ago.  But also leaving the charts in a state of near-term flux.  This means I can't refer to the charts and say, "Oh, hey, this is clearly near-term bullish, so..." And neither can I say the opposite.  The charts are essentially silent here (only on the near-term; the long-term is bearish), except in the sense that they're pretty bimodal:  We're likely either setting up for a decent bear market rally, or for a significant decline.

But here's my real problem:  My gut still says the market wants to rally some more, but I can't find much in the charts to justify that, and I have to present the charts as I find them.  Part of trading and analysis is learning to sort out what's "personal feeling" from objective reality.  The objective reality is that the charts are simply bimodal.  My personal feeling is that the market wants to rally some more.  The charts have to trump feeling, though.

This is also why I've stated several times that I'm open to whatever the market wants to do here -- because I am, as I don't value subjective reality above objective reality.  But I wanted to at least attempt to clarify what I'm feeling, for whatever it's worth.  With that out of the way, let's get to the charts.

Near-term, SPX is still above recent support:


BKX may offer an early warning to the broad market, in the event it were to sustain a breakout.  If it does not sustain a breakout, then that last rally was a simple ABC corrective wave:


Big picture remains unchanged, but I've added a reference to BKX:


In conclusion, the charts remain bimodal heading into Election Day, at least for the near-term.  The long-term remains bearish, since even an election outcome that might put DC into gridlock (gridlock is historically bullish for the economy -- strongly implying that the best thing for America almost always involves our government doing nothing) won't go back into the past to rewrite all the damage that has already been done.  Trade safe.

Friday, November 4, 2022

SPX Update: Inflection Zone Confirmed, But Options Remain

Last update expected that 3911 was an important inflection zone, and that the market would head lower, either in gray wave 4 or in the start of a new bear move.  The market then headed significantly lower, as Powell basically said he's going to keep breaking things until morale improves, and then promised to go to fisticuffs with anyone who doubts his resolve.

Investor psychology is now pretty bearish, because the market is slow and stupid and is just now finally getting the picture.  As I wrote back in May (yes, I'm probably going to refer to that piece again in the future), in Not Even the End of the Beginning:

[I]t seems the Fed only reaches its goals by continuing to feed volatility and destroying wealth until the economy is in recession. Thus, the Fed is not going to reverse course when the economy starts to struggle (unless inflation has abated), because they currently view a struggling economy as necessary to tame inflation. And the Fed won't bail the market out as it heads lower, because the Fed wants the market lower.

Now, with that out of the way... it's worth being aware that the market often likes to mess with the majority, and there are a lot of "newly-minted" bears after Powell's speech:


Big picture, I decided to try to simplify things as much as possible, for clarity:


Near-term, there may still be some value in the SPX trend line chart:


In conclusion, the big picture remains exceedingly bearish, but the market still has options near term, and blue 2 or red 2 (2nd chart) are still on the table and would be a lot of fun here, as it would really throw a lot of new bears off the trail.  Also, I should add that in the event we are already in blue 3 of red 3, then, in that case, 3 of 3 is usually a crash wave, so be aware of that.  Trade safe.