Amazon

Monday, October 17, 2022

SPX Update: Longest Inflection Zone Ever

Back in August, I first publicly discussed the current zone as an inflection zone, and it seems like we've been discussing it almost daily ever since.  I'm getting so tired of talking about it (and, of course, of the market being in it) that I even tried looking up "World's Longest Inflection Zone," but all Google suggested was that this record was held by a woman named Ida May Johnson of Orem, Utah... and I'm pretty sure that's wrong.

Anyway, yes, we're still in the inflection zone and apparently always will be.  Best I can determine, this is some type of trading Purgatory we've all been sentenced to, probably for making fun of Ben Bernanke's beard all those years ago.

No!  Of course, I'm only kidding!  Obviously, Ben Bernanke's beard was truly an object worthy of scorn, so no just Deity would punish us for that.  

Must have been something else.

Big picture can be summed up as, shockingly, "no material change":


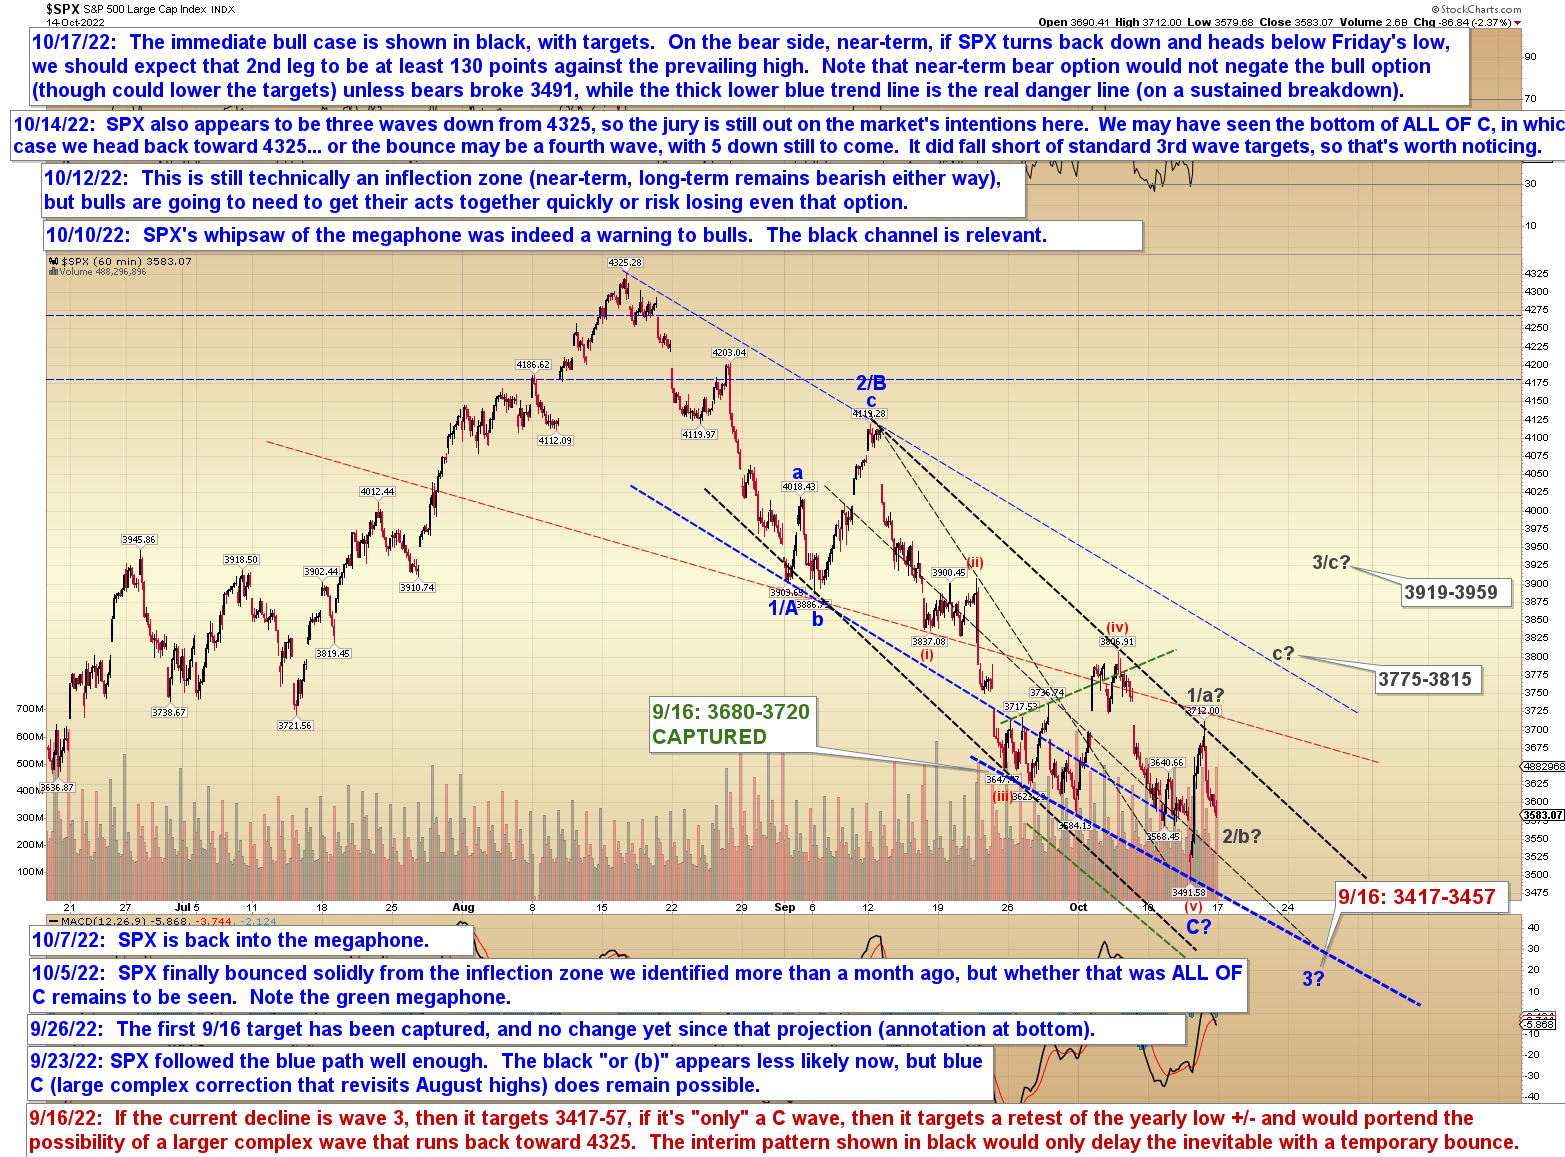
Near-term, I have drawn up some potential targets in the event the market can break out (i.e.- up) of Purgatory:


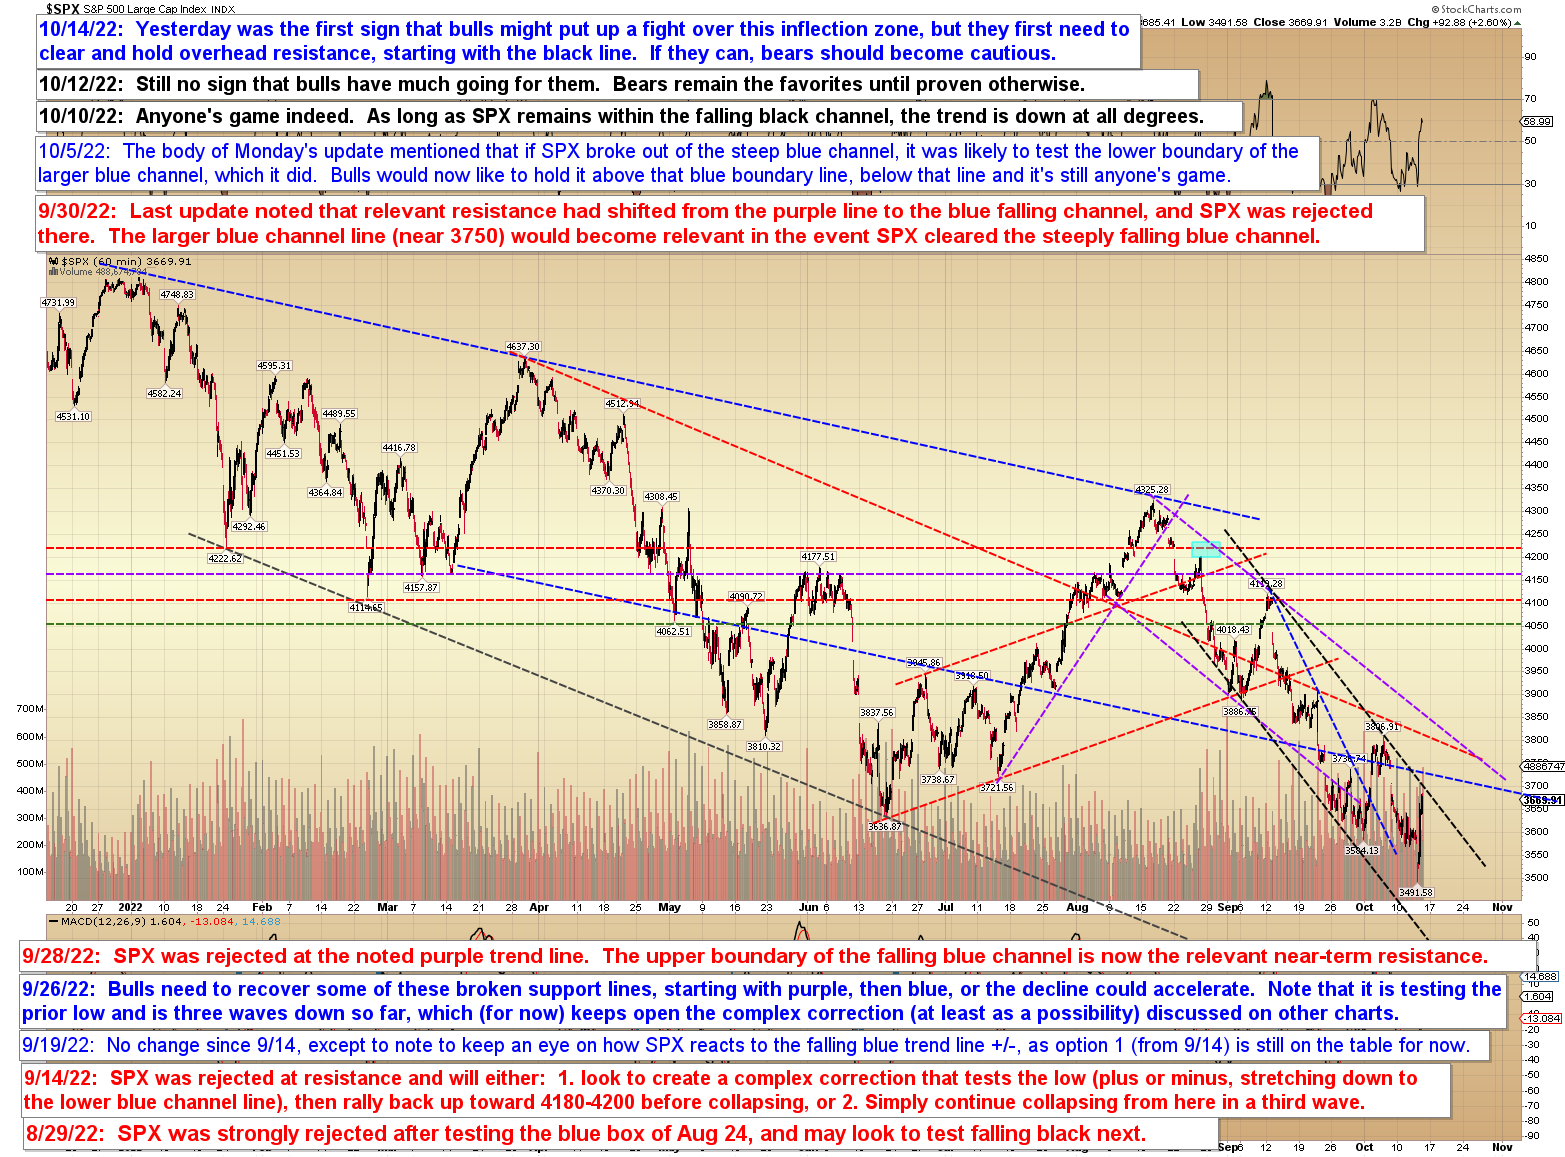
Finally, just the simple trend line chart:


In conclusion, I still believe bears need to be cautious if SPX can sustain a breakout over resistance, potentially very cautious -- but so far, it has not done so, though as of this exact instant, I'm slightly leaning toward the idea that it will (just a lean, though, and I might reassess that if we head much below 3540 SPX).  On the downside, bulls should be very cautious if SPX were to sustain trade below the thick blue lower trend line.  Trade safe.

Friday, October 14, 2022

SPX and BKX: Careful Out There...

Last update noted that bulls hadn't done anything encouraging yet, and they hadn't -- but the market is a dynamic environment, and bulls have finally taken the first potentially positive step toward turning things up from the inflection zone.  There are two things to note about the price point of yesterday's bounce:
  1. It's a bit deeper than would be expected from a standard c-wave
  2. It's a bit shallow for a standard third wave
The bounce effectively came from smack between the c-wave and third wave target zones.  What does that indicate?  Well, if it's the c-wave, it may simply indicate the magnitude of long-term selling pressure (note that this will not stop this bounce from now turning into a vicious rally).  If it's a third wave, then it probably isn't done yet.  It's a bit early to say, but the charts below will help outline some zones to watch, starting with BKX:


SPX also seems to show three waves down, though it's much less clear on SPX:


Finally, the simple trend line chart helps identify the next overhead resistance zones:


In conclusion, if SPX clears resistance, I do not believe bears should be quick to short this rally until it becomes a bit more clear what the market wants to do here.  If that was the bottom of the C-wave inflection we've been discussing, then the forthcoming rally is going to be so fast and brutal that it will fool many people into declaring the bear market to be "over" (it will not be over, though).  It will also rally hundreds of SPX points, and nobody wants to endure that sort of drawdown, or endure the "death by a thousand cuts" of shorting/stopping out, shorting/stopping out.  I recommend awaiting an impulsive decline to at least mark a zone to short against (not trading advice).

So the bottom line is, it's too early to say if this is just a short-lived dead cat bounce or the start of the larger C-wave rally -- but both options are very much on the table, so it's wise not to get tunnel vision.  Trade safe.

Wednesday, October 12, 2022

SPX Update: They Shoot Markets, Don't They?

Since last update, SPX has remained range-bound, which is probably not what bulls want to see.  Technically this is still within the near-term inflection zone (big picture remains bearish either way), but so far there's been nothing to give bulls hope.


On the simple trend line chart, bulls would first need to sustain a breakout above the black channel:


In other news, TLT is now within spitting distance of my April target:


On that subject, it seemed like a good time to bring the 10-year yield chart (also originally from April, and last updated in August) forward:


Finally, I realized that I forgot to include the target zone for oil's primary third wave, which is 249-285, so I added that to last update's annotation:


In conclusion, there's no real change from the past few weeks of updates, but so far bulls are not seeing much to give them near-term hope.  The long-term outlook remains bearish either way.  Trade safe.

Monday, October 10, 2022

SPX and Oil Updates

On October 5, I wrote:

[Y]esterday's violent rally could be the start of the complex blue 2 on the final chart, but I'd caution against reading too much into a "one day rally." Bulls will need to see some follow-through before getting their hopes up too much.

And last update concluded:

So far, bulls have not proven they have even the near-term ball, and it is still possible that this is all part of an intermediate bear wave.

Both of those warnings proved to be useful, and Friday's market dropped precipitously.  So far, the decline from last week's high appears to be three waves, so it's in the ballpark of a near-term inflection zone, but could simply be an incomplete impulse wave (which would mean more downside to come after some small fourth wave corrective rallies).


The simple trend line chart has remained useful:


No change to the big picture, but bulls are running out of real estate:


Finally, this seemed like as good a time as any to update the 11+ year-old legacy oil chart.  It's possible that ALL OF 2 down is complete, but the last wave of the decline is far from clear, so it likewise wouldn't be too shocking to see 2-down stretch a bit farther.  


In conclusion, by all rights, SPX looks like it probably needs to run lower still (after some small fourth waves), but this is a near-term inflection zone nested within a larger inflection zone, so that makes this a tougher call.  Trade safe.

Friday, October 7, 2022

SPX Update

Last update concluded: 

[Y]esterday's violent rally could be the start of the complex blue 2 on the final chart, but I'd caution against reading too much into a "one day rally." Bulls will need to see some follow-through before getting their hopes up too much.

So far, there has been no follow-through.  To the contrary, there's been a whipsaw back into the megaphone:


Same with the lower blue channel boundary:


And, big picture, bulls have not hurdled the key trend line yet:


In conclusion, no real change from last update:  So far, bulls have not proven they have even the near-term ball, and it is still possible that this is all part of an intermediate bear wave.  Regarding the "even bigger picture," it is my belief that this is still a bear market no matter what happens here.  Trade safe.

Wednesday, October 5, 2022

SPX Update

For the past week-plus, all we've done is talk about the fact that SPX was sitting smack dab in an inflection zone, so yesterday's violent rally comes as no real surprise.  Unfortunately, a one-day rally does not yet answer anything, and the last bottom isn't well-defined enough for me to make a high-confidence call as to its nature.  Accordingly, I've outlined some things to watch next, on the charts below.

Last update did note that if SPX could break out of the steep blue channel, it would likely rally toward 3750, which it did and then some.


From a wave perspective, there's really nothing to add yet:


Big picture, it's "pay me now or pay me later," and SPX will need to reclaim the broken green line to have a better shot at "pay me later":


In conclusion, yesterday's violent rally could be the start of the complex blue 2 on the final chart, but I'd caution against reading too much into a "one day rally."  Bulls will need to see some follow-through before getting their hopes up too much.  Trade safe.

Monday, October 3, 2022

SPX Update

One of the values of identifying inflection zones in advance is that it can warn us of areas where the market may spend some time seemingly "making up its mind," so to speak.  The current inflection zone has certainly displayed that characteristic, with SPX largely running sideways for the past week:


On the trend line chart, one option to keep an eye on:  First resistance is the steeply falling blue channel, but if SPX breaks out of that channel, it could run to the lower boundary of the larger blue channel.  If it cannot sustain trade back into that channel, it could then reverse again and head back below Friday's lows.  If it can sustain trade back into that larger channel, then next meaningful resistance is the falling black line.


Big picture, we're still in the same place:


And even bigger picture, we have fallen down to an old horizontal support line:


In conclusion, SPX remains stalled in the inflection zone, so there's still not much to add.  Trade safe.