Amazon

Monday, October 10, 2022

SPX and Oil Updates

On October 5, I wrote:

[Y]esterday's violent rally could be the start of the complex blue 2 on the final chart, but I'd caution against reading too much into a "one day rally." Bulls will need to see some follow-through before getting their hopes up too much.

And last update concluded:

So far, bulls have not proven they have even the near-term ball, and it is still possible that this is all part of an intermediate bear wave.

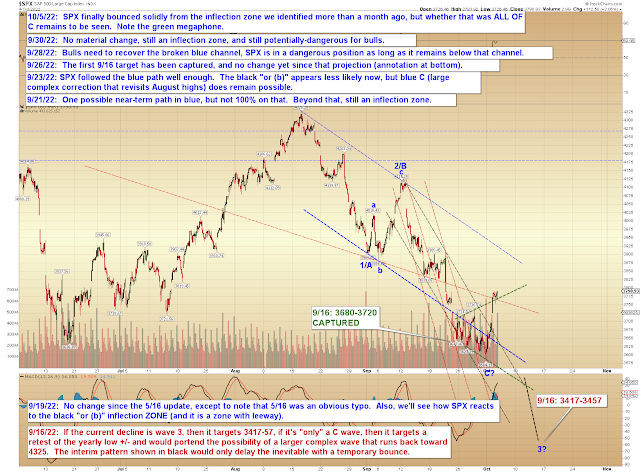
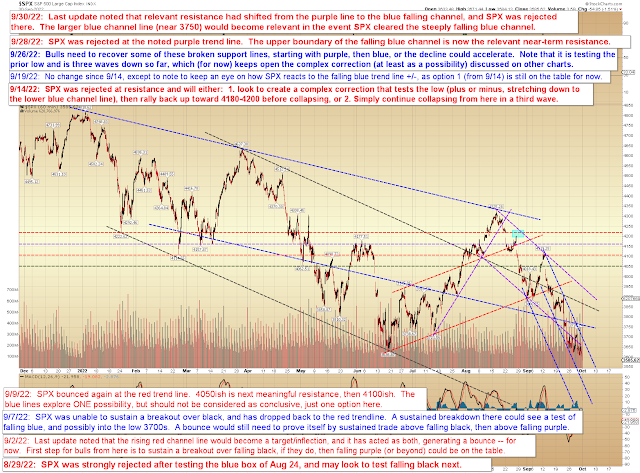
Both of those warnings proved to be useful, and Friday's market dropped precipitously.  So far, the decline from last week's high appears to be three waves, so it's in the ballpark of a near-term inflection zone, but could simply be an incomplete impulse wave (which would mean more downside to come after some small fourth wave corrective rallies).


The simple trend line chart has remained useful:


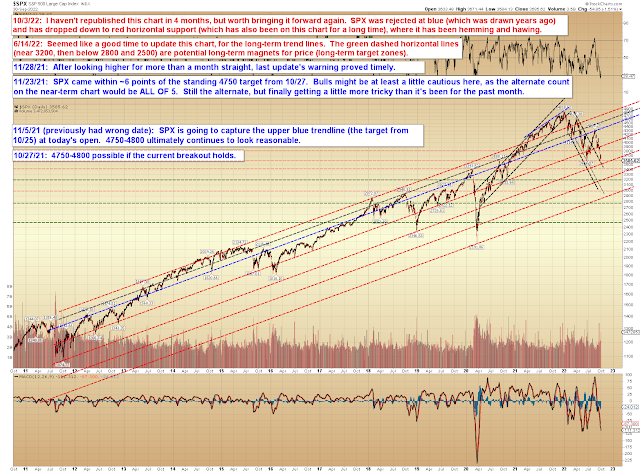
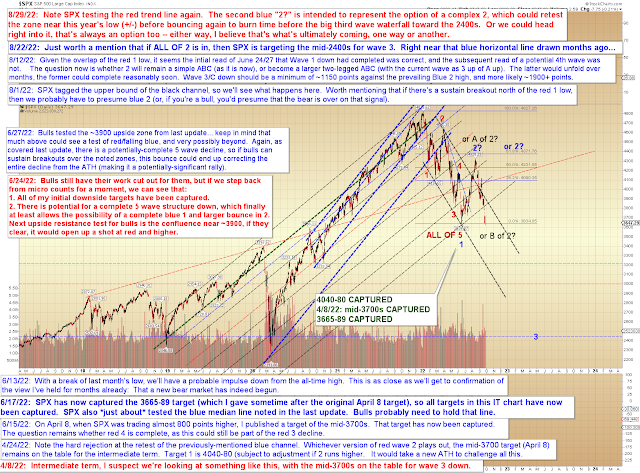
No change to the big picture, but bulls are running out of real estate:


Finally, this seemed like as good a time as any to update the 11+ year-old legacy oil chart.  It's possible that ALL OF 2 down is complete, but the last wave of the decline is far from clear, so it likewise wouldn't be too shocking to see 2-down stretch a bit farther.  


In conclusion, by all rights, SPX looks like it probably needs to run lower still (after some small fourth waves), but this is a near-term inflection zone nested within a larger inflection zone, so that makes this a tougher call.  Trade safe.

Friday, October 7, 2022

SPX Update

Last update concluded: 

[Y]esterday's violent rally could be the start of the complex blue 2 on the final chart, but I'd caution against reading too much into a "one day rally." Bulls will need to see some follow-through before getting their hopes up too much.

So far, there has been no follow-through.  To the contrary, there's been a whipsaw back into the megaphone:


Same with the lower blue channel boundary:


And, big picture, bulls have not hurdled the key trend line yet:


In conclusion, no real change from last update:  So far, bulls have not proven they have even the near-term ball, and it is still possible that this is all part of an intermediate bear wave.  Regarding the "even bigger picture," it is my belief that this is still a bear market no matter what happens here.  Trade safe.

Wednesday, October 5, 2022

SPX Update

For the past week-plus, all we've done is talk about the fact that SPX was sitting smack dab in an inflection zone, so yesterday's violent rally comes as no real surprise.  Unfortunately, a one-day rally does not yet answer anything, and the last bottom isn't well-defined enough for me to make a high-confidence call as to its nature.  Accordingly, I've outlined some things to watch next, on the charts below.

Last update did note that if SPX could break out of the steep blue channel, it would likely rally toward 3750, which it did and then some.


From a wave perspective, there's really nothing to add yet:


Big picture, it's "pay me now or pay me later," and SPX will need to reclaim the broken green line to have a better shot at "pay me later":


In conclusion, yesterday's violent rally could be the start of the complex blue 2 on the final chart, but I'd caution against reading too much into a "one day rally."  Bulls will need to see some follow-through before getting their hopes up too much.  Trade safe.

Monday, October 3, 2022

SPX Update

One of the values of identifying inflection zones in advance is that it can warn us of areas where the market may spend some time seemingly "making up its mind," so to speak.  The current inflection zone has certainly displayed that characteristic, with SPX largely running sideways for the past week:


On the trend line chart, one option to keep an eye on:  First resistance is the steeply falling blue channel, but if SPX breaks out of that channel, it could run to the lower boundary of the larger blue channel.  If it cannot sustain trade back into that channel, it could then reverse again and head back below Friday's lows.  If it can sustain trade back into that larger channel, then next meaningful resistance is the falling black line.


Big picture, we're still in the same place:


And even bigger picture, we have fallen down to an old horizontal support line:


In conclusion, SPX remains stalled in the inflection zone, so there's still not much to add.  Trade safe.

Friday, September 30, 2022

SPX Update: Time for the Market to Decide

The market remains stalled in the inflection zone that was identified weeks before we even got here (which is the market's version of "acknowledgment" of that zone) so there's still not a ton to add.  SPX again stalled at the noted trend line:


The near-term count continues to show why this is an inflection zone:


The intermediate chart shows the same:


And still no change to NYA:


Beyond that, I can find no reason to try to improve on the final paragraph from last update:

In conclusion, no real change since last update. All markets appear to be three wave declines so far, which means that any large bounce from here would create a new b-wave low (meaning the low would eventually be broken), because these patterns need to be five wave declines to be truly complete. Thus, we remain in a near-term inflection zone, where the market could choose to delay a bit longer, but bigger picture, the trend still remains down.

Trade safe. 

Wednesday, September 28, 2022

SPX, NYA, BKX: No Material Change

Not much to add since last update, and SPX remains in the inflection zone that we began anticipating a month ago:


Near-term, bulls still need to start recovering some of the broken trend lines:


SPX was rejected at the purple line we discussed in the last update:


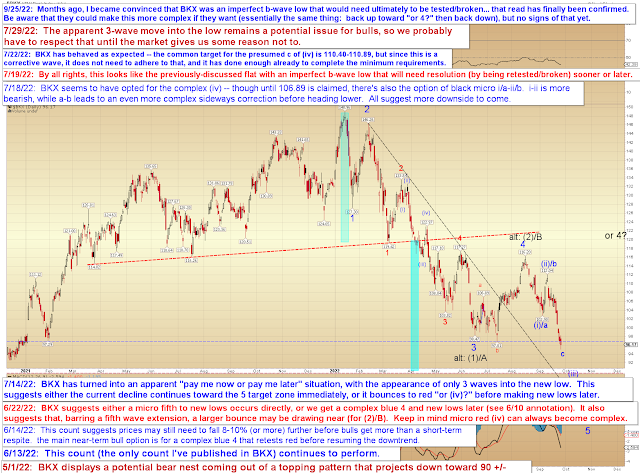
BKX is in the same position, though, since last update, it has "officially" confirmed the July read of a b-wave low (by breaking that low) -- but there was really never any serious doubt that it would:


NYA, likewise, is currently three waves down:


In conclusion, no real change since last update.  All markets appear to be three wave declines so far, which means that any large bounce from here would create a new b-wave low (meaning the low would eventually be broken), because these patterns need to be five wave declines to be truly complete.  Thus we remain in a near-term inflection zone, where the market could choose to delay a bit longer, but bigger picture, the trend still remains down.  Trade safe.

Monday, September 26, 2022

SPX, BKX, COMPQ, NYA: July's Read is Finally Confirmed

Way back in July, NYA and BKX formed patterns that I believed (in real-time) were "b-wave lows" -- in Elliott Wave terminology, a b-wave low is part of a pattern called an "expanded flat," which requires that, after a bounce, said b-wave low ultimately gets retested/broken.  Then we bounced a bit farther than I'd originally anticipated, which tested my resolve, but I simply couldn't see those July lows as anything other than b-waves, so I stood by my initial read.  

Months later now, and that resolve has finally paid off, as NYA broke below its (once suspected, but now confirmed) b-wave low:


SPX hasn't broken its low yet, but that's immaterial, really, because if SPX bounces here, then so does NYA, and we're right back in the same position of a new, larger b-wave low, as I've discussed since last month.  In other words, the market is still in a "pay me now or pay me later" position:


BKX is similar to SPX and NYA:


Here's how it lays out in the bigger picture, which remains unchanged to the point that I still don't feel anything needs to be added to the annotation from a month ago:


SPX's trend line chart suggests bulls need to start recovering some of these broken support lines, and soon:


Finally, COMPQ has reached a major confluence of potential support lines, which is interesting, given that I'm seeing three waves down (so far) across markets, and this implies that a bounce is at least possible in this zone.  Whether a bounce will materialize or not depends on whether the market is ready to let go now, or if it needs to fool a few more people before letting go later.  Either way, this bear market is still alive and well:


Finally, I want to refer back to a piece I wrote back in mid-May (see: SPX Update: Not Even the End of the Beginning), because I believe the things I said then are finally starting to become apparent to the world at large, and these (albeit late) realizations might have a strong psychological impact on investors:

[T]he Fed's goal is to achieve, essentially, a "negative wealth effect." Which means asset prices must fall. To the Fed's current mindset, the fall of asset prices is a feature, not a bug. The Fed is not worried with the S&P below 4000 -- the Fed wants the S&P below 4000. To achieve its goals in this environment, it needs SPX below 4000. And well below 4000.

 QE and government "stimulus" spending created runaway inflation; to reverse inflation, the Fed must reverse the effects of QE and government spending. The Fed needs demand to weaken and supply to increase, and in order to do that, the Fed must drain the excess liquidity that was poured into the market and the economy. 

Put simply: The Fed needs to destroy wealth to tame inflation. And, more importantly, it seems committed to that goal. 

Some bulls have argued that we won't see a recession because household and business balance sheets remain strong. But bulls are stopping their analysis too soon and aren't taking this to its logical conclusion: The Fed cannot tame demand if balance sheets remain strong. Which means that in order to achieve its goals, the Fed needs balance sheets to become weak, so destroying balance sheets becomes part of the plan. "Balance sheets remain strong" is thus not an argument that "there will be no recession," it is instead an argument the Fed will continue pushing the market down. 

By all current appearances, it seems the Fed only reaches its goals by continuing to feed volatility and destroying wealth until the economy is in recession. Thus, the Fed is not going to reverse course when the economy starts to struggle (unless inflation has abated), because they currently view a struggling economy as necessary to tame inflation. And the Fed won't bail the market out as it heads lower, because the Fed wants the market lower. 

Needless to say, this is not the same environment the market faced during the 13+ year bull; it is the complete inverse. Bulls have not yet come to terms with this new reality. Just as many bears struggled back in 2012 and 2013 with accepting the reality that Bernanke's Fed was committed to reflating every bubble it could, bulls will now suffer the same fate, in reverse. With every dip, they will assume the Fed is waiting just around the corner to again bail the market out. And why wouldn't they assume that? After all, that's what happened for the past 13 years. 

But the Fed will not bail the market out. Not this time. At least not yet.

In conclusion, July's chart analysis has finally been confirmed, and May's broader environmental analysis is finally becoming apparent to everyone.  The market is now in a position where it has to choose whether it wants to drag out the inevitable a bit longer with a more complex correction, or if it wants to simply continue declining rather directly.  In both cases, we are, in my estimation, nowhere near the end of this bear market, and things will get a lot worse before they get better.  Trade safe.