Amazon

Wednesday, September 7, 2022

SPX Update: Bounce or Break Territory

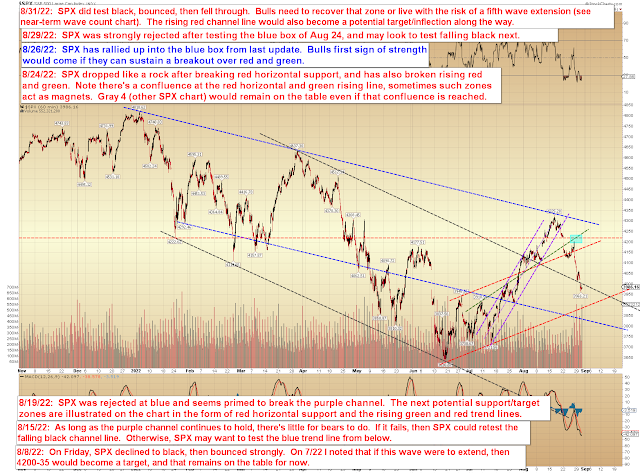
Last update speculated that there was at least a chance bulls might put together a bounce, but also noted that the onus was on bulls to prove that with a sustained breakout over the black trend line.  There was no sustained breakout, and SPX dropped back down to prior near-term support:


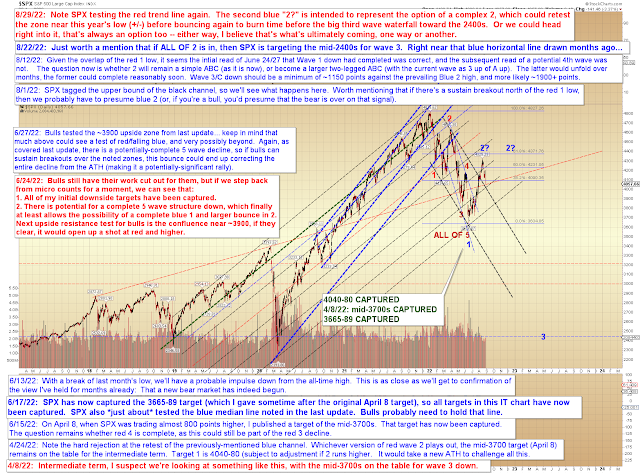
This means it's unclear if SPX is intent on following the extended fifth path we've previously discussed, but if SPX were to sustain a breakdown of the noted levels, then that path would remain very much on the table:


In conclusion, SPX's intentions are unclear -- as I noted back on 9/2, the red trend line (first chart, 2nd annotation) was something of an inflection zone... and as of Tuesday's close, SPX is sitting right on that inflection zone.  So this is "bounce or break" territory, but if bulls can't get it together here, then a sustained break could take SPX down to the next noted zones.  Trade safe.

Friday, September 2, 2022

SPX and TLT Update: Next Downside Zone Captured

Last update called out the 3900 zone on one chart and a rising trendline on another, both indicated as targets and potential support zones; time and price coincided on Thursday, as the 3900 zone and the trend line were both reached concurrently, leading to a bounce.

We can see on the chart below that the next hurdle for bulls is the falling black channel line:


On the short-term chart, I've sketched in a path, but that should be considered highly-speculative at this point, as if bulls fail to clear black (on the chart above), the decline could resume in full swing:


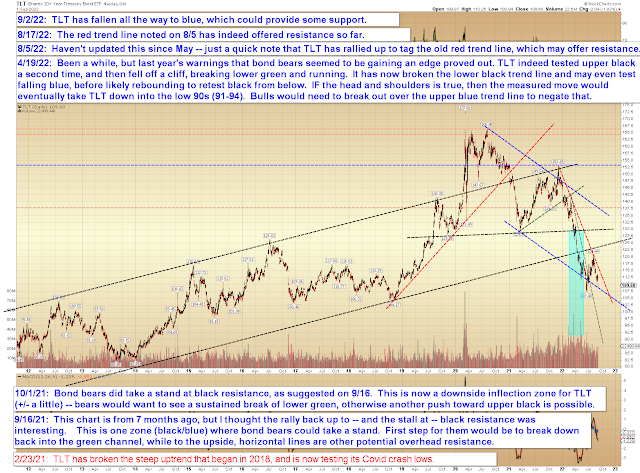
Interesting to note that TLT has reached a potential support area:


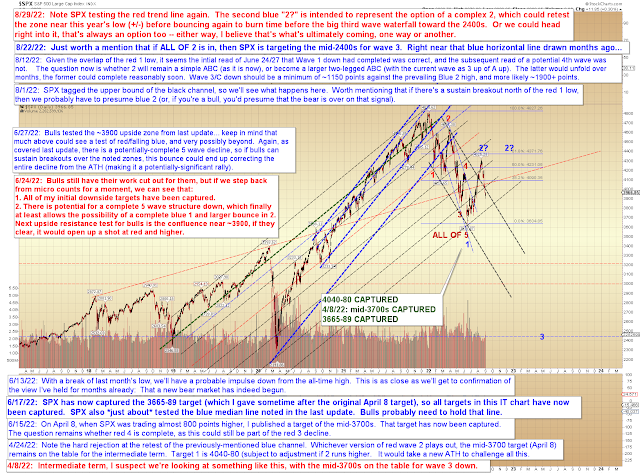
No change to the big picture:


In conclusion, last update's downside target/inflection zone was captured -- now it's up to bulls to prove they have enough firepower to generate a tradeable bounce.  If Thursday's low were to fail, then the falling blue trendline on the first chart would be on the table for the near-term.  Trade safe.

Wednesday, August 31, 2022

SPX Update: Still on Track, and a Brief Word on Bear Markets

 Last update expected SPX would test the falling black trend line, which it did, and also warned:

On the above chart, I noted that this is PRESUMED to be a fifth wave -- one of the tricky things during bear markets is that surprises come to the downside, and there is no law that says the current wave needs to complete in a "typical, usual, average" fashion. If it were to behave in the "typical" way, the black trend line (+/- a little) on the chart below would represent a logical spot for wave 5 to end and thus to wrap up the larger wave 1 down, leading to a wave 2 bounce. But I cannot stress enough that it does not "need" to do this, fifth waves can always extend, especially in bear markets.

On Monday, SPX indeed tested black, bounced, and then gapped beneath it on Tuesday.  It's highly important for traders, and for us, to stay ahead of the curve, and part of the way we're staying ahead of the masses is by simply recognizing that this is now a bear market.  And part of what "bear market" means is that support is going to fail routinely.  As my friend Lee Adler has said: "There's no such thing as support in a bear market."  I recommend taking those words to heart.  

As I've mentioned for most of 2022, this is no longer the environment of the past 13 years, where "buy the dip" used to work on automatic.  The environment has fundamentally changed to one of "sell the rip."  It's the polar inverse of the past 13 years, and one of the things that's so dangerous in bear markets is that by the time all those years of "buy the dip" conditioning have finally, truly been beat out of most people, the bear market is closing in on a big rally (where, ironically, buy the dip would work again).  But it usually doesn't happen before then.

Countertrend trading in most markets is only recommended for experienced and highly nimble traders, and this becomes doubly true during bear markets, because bear markets are completely unforgiving of poorly-timed longs.  It helps to remember that the goal of the market now is to separate longs from their money -- and then, once you've come to terms with that, ask yourself if you want to throw your lot in with them by trying to beat the primary trend for a few quick short-term scores.  If you're nimble and experienced, you may be able to do it; bear market rallies are fast and powerful, and there's lots of money to be made in them -- but those types of rallies are also few and far between, and typically only arrive after large wipeout declines, when the pundits are only able to manage vacant stares... so please choose your battles very carefully.

Please don't recognize the bear and then get wiped out by trying to be a bull.

Anyway, let's look at some charts, starting with the SPX trend line chart:


Near-term, this is still presumed (as in last update, I use that word quite intentionally; the most bearish case would be a deeply-nested third wave) to be a fifth wave:


Big picture:


In conclusion, the first thing bulls need to do is reclaim the broken black trend line (1st chart).  If they can do that, then they could put together a larger bounce, or at least a sideways time-burner.  If they can't, then a fifth wave extension stays on the table.  Overall, everything appears to continue to be on track for the read I've emphasized for the past couple weeks:  Namely, that bears have regained control.  Trade safe.

Monday, August 29, 2022

SPX Update: Confirmation

Back on August 19, I wrote:

[O]n the first two charts, we can see that bears have formed a small impulse down (blue 1/A), but still have work to do in order to create a larger impulsive turn, which is what's required in order to suggest a larger trend change. I'm leaning toward the idea that they will (and that we've about seen the end of this bear market rally), but that's just a pure hunch, so take it with a grain of salt -- from an objective scientific standpoint, it's too early to say whether or not this decline will become impulsive.

In every subsequent update, I reiterated that I believed we were witnessing the start of a meaningful turn, though because it's hard to quantify the "it just feels right" instincts that come from 20+ years of tape reading, I also continued to caveat that we had no objective confirmation yet.  

Well, now we do.

On Friday, SPX finally added the structures needed to suggest a larger impulsive decline from this month's highs, and thus seems to have confirmed my read:


On the above chart, I noted that this is PRESUMED to be a fifth wave -- one of the tricky things during bear markets is that surprises come to the downside, and there is no law that says the current wave needs to complete in a "typical, usual, average" fashion.  If it were to behave in the "typical" way, the black trend line (+/- a little) on the chart below would represent a logical spot for wave 5 to end and thus to wrap up the larger wave 1 down, leading to a wave 2 bounce.  But I cannot stress enough that it does not "need" to do this, fifth waves can always extend, especially in bear markets -- so it's just something to be aware of.


Bigger picture, it increasingly looks like either ALL OF Blue 2 is complete, or ALL OF Wave A of Blue 2 is complete.  The latter option has some appeal, because it would allow Blue 2 to burn more time before the big third wave -- but again, bear markets, downside surprises, yada yada, everything I just said a paragraph ago.


In conclusion, SPX has now formed an apparent larger impulse down from this month's highs, suggesting that bulls will be taking the back seat for a while.  Trade safe.

Friday, August 26, 2022

SPX Update

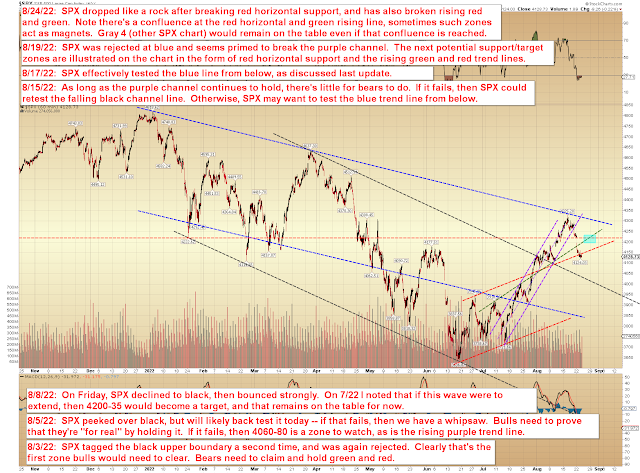
Last update warned that the downside inflection zone had been reached, which was expected to trigger a fourth wave bounce (at the minimum), and as it turns out, I really couldn't have hit the turn much better than that.  SPX bounced almost immediately and has headed toward the confluence that was noted last update:


SPX ran to the gray "4?" that was previously shown on the chart below, corrected lower, then ran up and past it.  If this is a fourth wave, it still has additional room before the invalidation level, due to the depth of the previous decline:


In conclusion, last update's inflection zone warning and call for bear caution proved timely, so I do hope that was helpful for readers.  As discussed last update, the decline would still need another wave down to become impulsive, so for now the market has kept its options open -- though I do continue to suspect that a larger turn/decline has begun, I again have to stress that I cannot back that instinct with anything objective yet.  Trade safe.

Wednesday, August 24, 2022

SPX, NYA, TLT: Inflection Zone

On August 17, I suggested it was a good time for bears to show up again, and then I followed up on August 19 with a "gut instinct" call that the bear market rally had ended.  SPX has now lost 200 points from its high of August 16, so these calls have worked out well, but we do have to remain aware that SPX has yet to form a larger impulsive decline.  We can see on the chart below that this is technically still three waves down from 4325, making the current area an inflection zone:


Looking at the trend line chart, we can see that SPX has room to form a large gray 4th wave if it is so inclined:


No change to the big picture:


TLT has now formed a significant decline from the trend line that was called out back on August 5:


No change to NYA:


In conclusion, the next couple sessions are going to be the "make or break" for bears (and bulls, if viewed the other way).  SPX has formed three down so far, and while there's every indication this is going to become an impulsive decline (and while I continue to suspect it will), it has not yet officially done so.  Trade safe.

Monday, August 22, 2022

SPX, INDU, NYA, TLT: Downside Targets (Will Be) Captured

In the last update, we discussed that SPX and INDU had formed impulsive declines, which targeted 4185-4209 and 33400-520 respectively.  Those targets will be reached today.  Last update also concluded:

...on the first two charts, we can see that bears have formed a small impulse down (blue 1/A), but still have work to do in order to create a larger impulsive turn, which is what's required in order to suggest a larger trend change. I'm leaning toward the idea that they will (and that we've about seen the end of this bear market rally), but that's just a pure hunch, so take it with a grain of salt -- from an objective scientific standpoint, it's too early to say whether or not this decline will become impulsive.

There is no change to either my lean or the fact that I still can't give you a chart showing why I'm leaning that way, because the market has not yet formed a larger impulsive decline -- so the appropriate caveats still stand.

SPX will capture its target at the open, but has created the possibility (not a guarantee) for a continued decline beyond it:


Same situation in INDU, sans sketch:


The basic trend line chart remains useful:


No change to the big picture, except the addition of a calculation:


NYA has broken down from its channel:


And TLT has continued its decline since hitting the resistance zone mentioned on August 5:


In conclusion, last update is going to prove to be a hit, as SPX and INDU will both capture their target zones.  Beyond that, no change from last week's outlook.  Trade safe.