Amazon

Friday, August 26, 2022

SPX Update

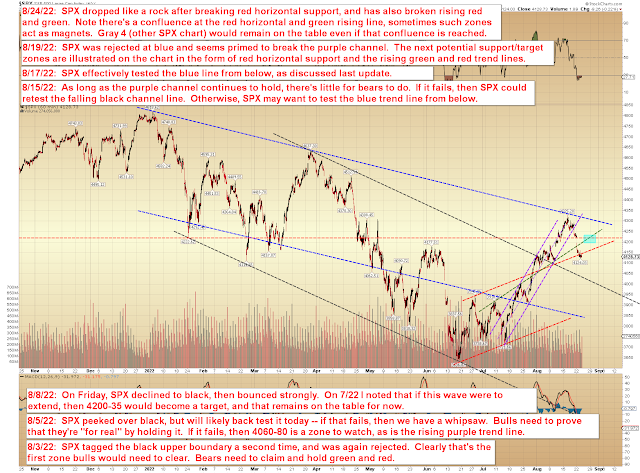
Last update warned that the downside inflection zone had been reached, which was expected to trigger a fourth wave bounce (at the minimum), and as it turns out, I really couldn't have hit the turn much better than that.  SPX bounced almost immediately and has headed toward the confluence that was noted last update:


SPX ran to the gray "4?" that was previously shown on the chart below, corrected lower, then ran up and past it.  If this is a fourth wave, it still has additional room before the invalidation level, due to the depth of the previous decline:


In conclusion, last update's inflection zone warning and call for bear caution proved timely, so I do hope that was helpful for readers.  As discussed last update, the decline would still need another wave down to become impulsive, so for now the market has kept its options open -- though I do continue to suspect that a larger turn/decline has begun, I again have to stress that I cannot back that instinct with anything objective yet.  Trade safe.

Wednesday, August 24, 2022

SPX, NYA, TLT: Inflection Zone

On August 17, I suggested it was a good time for bears to show up again, and then I followed up on August 19 with a "gut instinct" call that the bear market rally had ended.  SPX has now lost 200 points from its high of August 16, so these calls have worked out well, but we do have to remain aware that SPX has yet to form a larger impulsive decline.  We can see on the chart below that this is technically still three waves down from 4325, making the current area an inflection zone:


Looking at the trend line chart, we can see that SPX has room to form a large gray 4th wave if it is so inclined:


No change to the big picture:


TLT has now formed a significant decline from the trend line that was called out back on August 5:


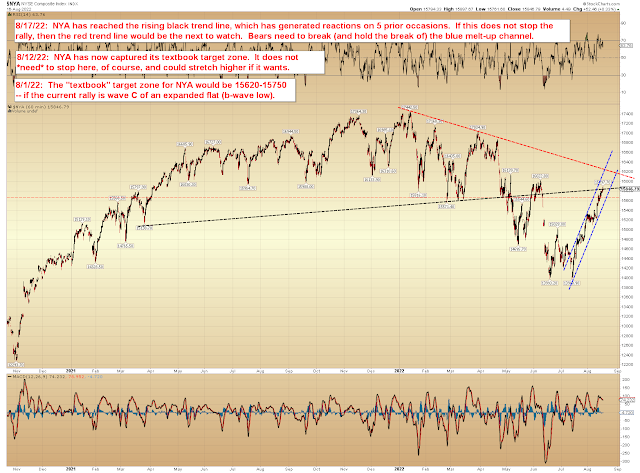
No change to NYA:


In conclusion, the next couple sessions are going to be the "make or break" for bears (and bulls, if viewed the other way).  SPX has formed three down so far, and while there's every indication this is going to become an impulsive decline (and while I continue to suspect it will), it has not yet officially done so.  Trade safe.

Monday, August 22, 2022

SPX, INDU, NYA, TLT: Downside Targets (Will Be) Captured

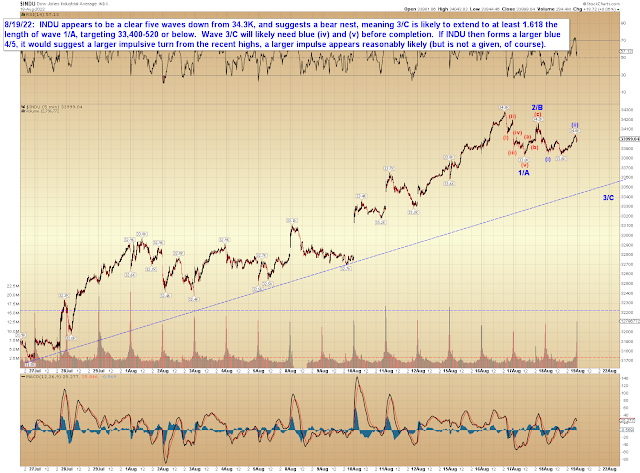
In the last update, we discussed that SPX and INDU had formed impulsive declines, which targeted 4185-4209 and 33400-520 respectively.  Those targets will be reached today.  Last update also concluded:

...on the first two charts, we can see that bears have formed a small impulse down (blue 1/A), but still have work to do in order to create a larger impulsive turn, which is what's required in order to suggest a larger trend change. I'm leaning toward the idea that they will (and that we've about seen the end of this bear market rally), but that's just a pure hunch, so take it with a grain of salt -- from an objective scientific standpoint, it's too early to say whether or not this decline will become impulsive.

There is no change to either my lean or the fact that I still can't give you a chart showing why I'm leaning that way, because the market has not yet formed a larger impulsive decline -- so the appropriate caveats still stand.

SPX will capture its target at the open, but has created the possibility (not a guarantee) for a continued decline beyond it:


Same situation in INDU, sans sketch:


The basic trend line chart remains useful:


No change to the big picture, except the addition of a calculation:


NYA has broken down from its channel:


And TLT has continued its decline since hitting the resistance zone mentioned on August 5:


In conclusion, last update is going to prove to be a hit, as SPX and INDU will both capture their target zones.  Beyond that, no change from last week's outlook.  Trade safe.

Friday, August 19, 2022

SPX, INDU, COMPQ: Bears Off to a Good Start

 Last update concluded:

...multiple markets have tagged potential resistance zones concurrently, and that may cause a negative reaction. 
In other words, if bears are going to show up again, this is as good a time as any for that to happen. Maybe even better.

And bears have indeed finally shown up again.  Let's dive into the charts and resume the discussion after that, starting with INDU:


SPX looks very similar:


From a trend line perspective, SPX is on the verge of breaking down from the purple melt-up channel:


NYA was rejected on its test of the noted black trend line:


Nothing added to the SPX intermediate chart yet:


And nothing added to the COMPQ intermediate chart yet:


In conclusion, on the first two charts, we can see that bears have formed a small impulse down (blue 1/A), but still have work to do in order to create a larger impulsive turn, which is what's required in order to suggest a larger trend change.  I'm leaning toward the idea that they will (and that we've about seen the end of this bear market rally), but that's just a pure hunch, so take it with a grain of salt -- from an objective scientific standpoint, it's too early to say whether or not this decline will become impulsive.  Also, although futures are suggesting a gap down open, be aware that there is an option for a less direct route than shown on the first two charts, in the form of an immediate rally back up toward 4287-4300, which could then be followed by a renewed decline later today or Monday.  Trade safe.

Wednesday, August 17, 2022

SPX, COMPQ, NYA, TLT: As Good a Time as Any

Since last update, SPX rallied up to tag the trend line we discussed:


Now, what's interesting is how things seem to be lining up across several markets, starting with COMPQ:


NYA also tagged a trend line that has been relevant to that market in the past:


And remember TLT, which I noted a couple weeks ago?


Interesting how that trend line above lines up with the 200-month MA on the 10-year yield:


No change to the big picture, and I still believe this is a bear market rally:


In conclusion, multiple markets have tagged potential resistance zones concurrently, and that may cause a negative reaction.  It's interesting how these all line up not only with each other, but also with the release of the Fed minutes today.  Treasury (smart money) yields began rising a couple weeks ago, when TLT tagged the trend line noted in the 4th chart on August 5, but the market (dumb money) has ignored that so far, in hopes that the Fed will decide that the 8.5% inflation of July is just so much better than 9.1% inflation (from June) that we can happily resume the free-money-party of the past decade-plus.  Which seems like a silly thing to hope for.

In other words, if bears are going to show up again, this is as good a time as any for that to happen.  Maybe even better.  Trade safe.

Monday, August 15, 2022

SPX Update, and a Deadhead Sticker on a Cadillac

Last update discussed that the current rally is correcting the entire decline from the all-time high, and thus of the same wave degree as the first leg down.  On Friday, SPX rallied again, but did close near a zone that, based on the structure of the prior decline wave, could provide horizontal resistance, so we'll see how it reacts to that.  Looking at the trend picture, the first thing bears need to do is break the rally channel:


Bigger picture, Friday's high was between the 50 and 61.8 Fibs:


In conclusion, there's not much to add to Friday's update beyond that.

On a lighter note:  Yesterday, I ended up behind a car that had a "Who Is John Galt?" license plate frame -- what made me laugh out loud was that the car was a Toyota Prius hybrid.  This struck me as the near-perfect inverse of Don Henley's famous line: "Out on the road today, I saw a Deadhead sticker on a Cadillac."  Two symbols that tacitly represent ideologies that don't really mesh together.

Anyway, that's all I've got for today.  Trade safe!

Friday, August 12, 2022

SPX and NYA: Big Question Finally Answered

Since last update, SPX captured and exceeded the 4200-35 extension target, which suggests that the current rally is a high-degree second wave that is correcting the entire bear market to date.  This in turn allows us to form some educated projections about the length of the next leg down.  

What it does not do (yet) is tell us the form that the current Wave 2 rally will take.  The rally is presently three waves up, which is "enough" structure for it to complete soon -- however, it is entirely possible that we're only witnessing a portion of a still larger fractal, meaning that the three up could become five up, which would then mark a larger Wave A of 2, to be followed by B-down and a similar-sized C up.  As noted previously, bears might want to await an impulsive turn (or otherwise low-risk entry) for this reason.


NYA has captured its "textbook" target:


The SPX trend line chart shows that SPX is currently whipping and sawing around the red horizontal; how it ultimately resolves here may offer some near-term clues.


In conclusion, the good news is that we now have a definitive answer to the "is this wave 2 or wave 4?" question, and we're able to form some downside projections for the next wave based on that.  What is not yet clear, however, is whether the wave is closing in on completion or not.  Also, if you're a bull, you take this as a signal that the bear market is over.  I'm not a bull here, but just throwing it out there for those who are and were waiting for a clear signal.  Trade safe.