Amazon

Wednesday, August 3, 2022

SPX and BKX: Inflection Zone

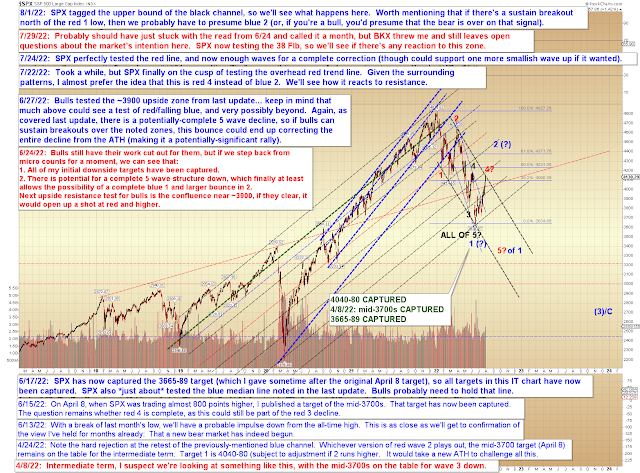
Last update discussed a (presumed) trend channel, and SPX has now reacted to that channel, so that's as close to "confirmation" [of a theoretical line drawn on a chart] that it gets in this biz.  


This leaves both options (fourth wave vs. second wave) on the table for now -- in other words, the current zone, stretching up to the bottom of Red 1, is an inflection zone where bears could reverse things:


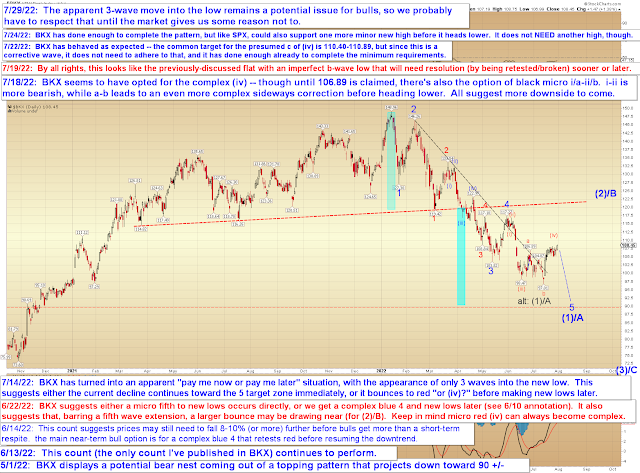
No change to BKX, which remains a possible thorn for bulls:


In conclusion, the market is into a zone where a reversal could occur -- IF this is a fourth wave.  As I noted last update, it's somewhat unclear whether the current wave is a fourth or a larger second (which could run beyond the bottom of Red 1), but in either case, I want to reiterate that I remain long-term bearish -- so, regardless of whether this bounce is 4 or 2, I presently believe this is still a bear market (in case anyone had any impressions to the contrary).  In fact, until the bottom of Red 1 is overlapped, there's really no reason to give any significant consideration to larger bull options (at least as far as the technicals go).  Trade safe.

Monday, August 1, 2022

SPX, BKX, NYA Updates

I'm just going to be forthright here:  I'm not too pleased with myself right now.  Here's how I got here:  Back in June, I thought I saw this rally coming and I wrote about that (on June 27) -- the problem was, that was largely based on gut instinct (which can be hard to trust in the face of seemingly-contradictory evidence), so in July, when BKX made a low that looked like three waves (as did NYA), I threw my instinct out the window in favor of what appeared to be hard chart evidence.  I wrote off my first read in favor of the new read, and I believe now that was a mistake.  

My apologies for that error.

So is this a fourth wave or a second wave?  I genuinely don't know.  As of this moment, it could still be either; the chart explains the dividing line:


BKX is still a pain for all involved, and no change here:


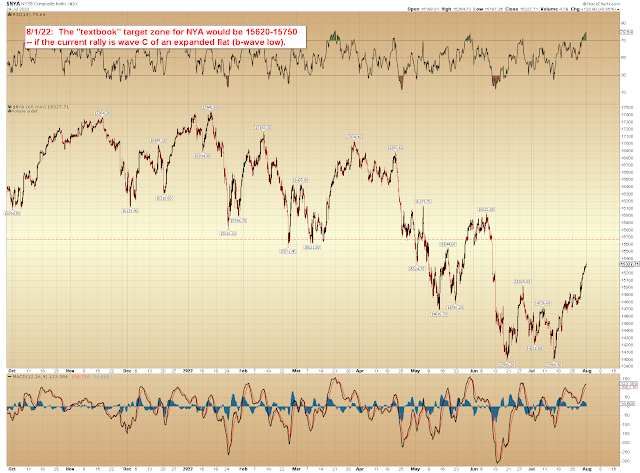
I noted back on July 22 that in the event the current wave were to extend, then SPX 4200-35 would be a target.  Given BKX, I thought that unlikely at the time, but now -- who knows.  NYA says that it's at least possible:


So, with the wave counts up in the air, I often like to return to basics.  Below is a simple trend line/channel chart:


The irony is that as I write this, futures are down 26 points, so maybe there will be a significant reaction to the black trend line on the chart above, and we'll all have a good laugh about this later.  

In conclusion, SPX is in a sort of no-man's-land right now, where a fourth wave or second wave are both still on the table.  All I can do from here is try to take it as it comes.  Trade safe.

Friday, July 29, 2022

SPX and BKX: Bad News is Good Again

So it appears the market has reverted to "bad news is good" mode, with investors jumping in on the hope that crummy econ data will cause the Fed to slow down -- of course, that line of thinking relies upon a number of questionable presuppositions:
  1. It presupposes that the Fed has near-complete control over the market.
  2. It presupposes that if the Fed slows down, then the bull market will return -- despite the fact that the prior bull market was not supported by a "slowing/neutral Fed," it was supported and driven by a Fed that had both feet on the liquidity accelerator.  
  3. It presupposes that bad econ data will fix inflation, thus allowing the Fed off the hook.
  4. It presupposes that everything else in the world goes swimmingly -- which means, among other things, that Russia will simply back down, oil will suddenly flow abundantly again, and our Vaunted Leaders will stop (seemingly) actively working to destroy America and the American people.
  5. It essentially presupposes that "good times are here again, just as long as that pesky Fed doesn't ruin everything!"  Which is kind of laughably naive, when you think about it.
But hey, if the market were rational, then we wouldn't need a market in the first place.  We could just plug-in a complex mathematical formula to determine the prices of everything, and then we could go back to watching Netflix, which would only cost 8 cents per month (see how perfectly this formula works?).

Chart-wise, SPX has now sneaked above the red line and is flirting with the 38 Fib:


While BKX is still a thorn in my analytical side:


In conclusion, last update noted:  

Nevertheless, in the event of a breakout, there is potential resistance not far above, in the 4085-4100 zone.

And futures are into that zone now, so we'll see how the market reacts to it, then take it from there.  In SPX, the current rally is still just three waves up and not yet a larger impulse, so it is still a corrective form -- for now.  Trade safe.

Wednesday, July 27, 2022

SPX, BKX, COMPQ, INDU Updates: Top Looks Closer than the Bottom

Last update expected lower prices, and the market obliged, but futures are indicating a gap up that retraces some of the decline, so they're not going to make it simple (as usual).  Let's start by taking a look at the Dow Jones Industrial Average (INDU), though, which suggests that a gap up might end up being sold:


I haven't updated anything on the SPX chart below, because Stockcharts is still deleting my annotations and making me redo all of them (part of the New Cruelty at Stockcharts), but the only things I would add are that:

1.  SPX overlapped the black A/1 high, which is generally not bullish
2.  Nevertheless, in the event of a breakout, there is potential resistance not far above, in the 4085-4100 zone:


Not much to add in BKX:


COMPQ is backtesting/flirting with possible overhead resistance:


While the SPX intermediate chart suggests that even if there is a breakout over the ~4012 high, the market is going to run into red resistance again, just above that high (since that's a rising trend line):


In conclusion, today is a Fed day, so the market usually finds a way to kill time until the announcement.  Given the larger pattern in BKX, I continue to lean toward the idea that the final low isn't in for this wave yet -- the question seems to be more whether the high is in yet.  I suspect it's either in, or it's reasonably close (as noted on Monday, several markets, including SPX, could support another smallish wave up).  Of course, we have to know the flip side of the coin, and in the event SPX were to sustain a breakout over the 4100 zone on increasing momentum, then I'd need to reassess.  Trade safe.

Monday, July 25, 2022

SPX and BKX: Minimum Upside Target Now Captured

Last update decided we'd stick with the most straightforward count for the time being, and the market obliged by reacting to resistance on the nose:


On the chart above, I have changed the color of some of the labels, as I somewhat like the idea that this current wave is red 4, with us still in the larger wave 1 down.

Near-term, SPX captured its target zone:


BKX has done enough to call it complete if it wants:


In other news, The WHO officially declared Monkeypox a global emergency, then smashed their amplifiers with their guitars, before performing an encore of "Magic Bus."  I don't know why we have to listen to Pete Townsend on global health issues and think The WHO should stay in their lane, but whatever, I thought it interesting as it might serve as "news" to give the pundits a "reason" for the market to decline in a fifth wave ("Oh, the rally was underway, but then MONKEYPOX yada yada yada, bulls just can't catch a break!")

In conclusion, there are enough waves in place for the market to reverse here.  It's always tricky determining if there's still "one more little wave up" needed, and that's the case here as well -- so the pattern could support slightly higher prices, but they are neither required nor desired.  If you held my feet to the fire, I'd probably lean toward the idea that the top is in for this wave, but I would heavily hedge that lean with the standard caveats.  Trade safe.

Friday, July 22, 2022

SPX and BKX: Wait and "C"

Since last update, SPX continued up toward the "straightforward c-wave" target zone of 4005-45, ending the session just shy.  Let's start with the near-term SPX chart:


Interesting to notice how the target for black C lines up with red resistance on the longer-term chart:


BKX has done the minimum that was required for a b-wave low, c-wave rally (a presumed expanded flat, in this case), but could certainly support higher prices if it wants to adhere in a more textbook fashion:


In conclusion, while there are still other options here, for now we're going to stick with the most straightforward of them (which is: black wave C, as discussed above), and wait to see how SPX reacts to the upcoming resistance zone, in order to determine if we even need to discuss any other options.  Trade safe.

Tuesday, July 19, 2022

SPX and BKX Updates: Market May Have Had Enough of Making It Easy

The last couple of weeks in the market have formed a complex pattern, but we've stayed one step ahead of it the whole time, so it's been relatively easy to predict -- but things may be about to grow much less predictable.  Because the market is complex enough on its own, I don't like to present too many options (even though such options often exist in reality), since then things get too confusing for readers, so today we're just going to focus on the two most straightforward options, then we'll see what the next session or two bring.

First up, let's look at BKX again, to confirm that it does indeed appear to be three waves into the last swing low:


I always study other charts to see if I can find the broader pattern stretching across multiple markets -- and as it happens, NYA seems to share the appearance of a three-wave low with BKX:


So, while nothing's perfect, two major markets have the appearance of three-wave lows, which argues that the low is most likely a b-wave and thus ultimately destined to fail.

Where it gets tricky is, as I alluded to at the start, that there are multiple paths the market can take between here and there.  The two most straightforward are discussed on the SPX chart below, but I want to stress that these are far from being the only interim options -- thus, "stay nimble" (the theme a few updates back) continues to apply:


In conclusion, we seem to see more than one market adhering to the theme of an imperfect low that will ultimately need to be revisited for resolution, but by no means does this need to occur immediately.  It could occur immediately, if SPX takes the super-simple red 2/b path and stalls directly -- but if it doesn't, then we'll examine more potential paths in the next update.  The simple takeaway is:  Any way we slice it, SPX will most likely revisit the "structural support zone" at least one more time.  Trade safe.