Commentary and chart analysis featuring Elliott Wave Theory, classic TA, and frequent doses of sarcasm.
Work published on Yahoo Finance, Nasdaq.com, Investing.com, RealClearMarkets, Minyanville, et al
Join the ongoing discussion with our friendly, knowledgeable, and collegial forum community here!
Amazon
Friday, July 8, 2022
SPX Update
Wednesday, July 6, 2022
SPX and INDU: Harbinger?
Since last update, there's been another test of and bounce at support... however, INDU made a new low during that test, which might be a warning that yesterday's low is a b-wave low (meaning that low will be revisited/broken):
INDU's (unannotated) chart below:
In conclusion, on the one hand, support held again -- however, the new low in INDU is probably not what bulls wanted to see, as that can be a warning of a temporary low. SPX, of course, did not make a new low, so this isn't crystal clear, and maybe INDU simply needed a fifth wave to wrap up its decline... but it's certainly a caution signal for bulls, at the minimum. If the bounce in SPX continues, then watch 3845-55 and 3868-75 as potential resistance zones. Other than that, no real change from the past couple updates. Trade safe.
Friday, July 1, 2022
SPX and BKX: Support Does Its Thing
Wednesday, June 29, 2022
SPX, BKX, COMPQ, NYA: Next Zones to Watch
Monday, June 27, 2022
SPX, BKX, NYA: SPX ~3900 Hit
Friday, June 24, 2022
SPX, BKX, COMPQ: Picking Nits
Wednesday, June 22, 2022
SPX Update: One Chart to Rule Them All
Well, I have begun a longer piece, but I can already tell I'm not going to finish it in time, so this is the abridged version. With any luck, I'll complete the longer piece for Friday or Monday. The only thing about that is that the chart below (SPX, not BKX; second chart) inspired the longer piece, so it feels a bit naked without it, but I suppose I can always publish the chart again. So let's start here:
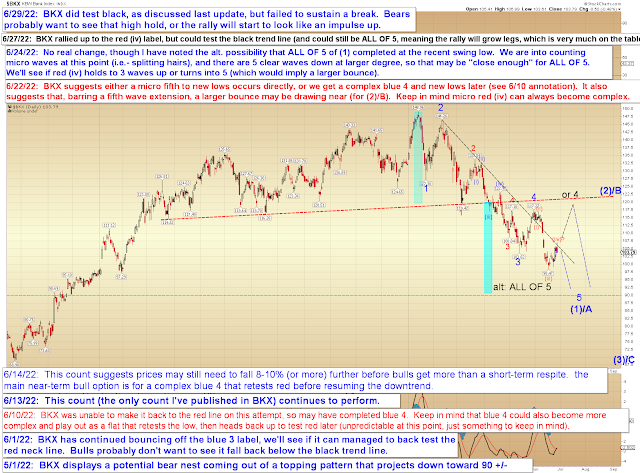
The near-term charts are a bit mixed: Some seem to suggest we may be closing in on a bounce, others seem to suggest waterfall potential; if we refer to the BKX chart below, this dichotomy makes some sense, as we appear to be in a fifth wave, and fifth waves are the final waves that complete a larger structure, thus they tend to suggest a bottom of sorts is near... but if they extend, then they waterfall.
Presumably, SPX and BKX will track reasonably closely in structure over the next few sessions. Personally, I'd like to see a standard fifth here (not a waterfall extension) to relieve some of the bearish sentiment and give pundits some hope before the next leg down. So in a perfect world, that's what we'd get -- but just keep in mind the market always reserves the right to form a fifth wave extension.
While sustained trade above Tuesday's high might be viewed as a caution signal for bears (as one option would be the larger complex black "or 4" on the chart above).
Either way, due to a question I received a few days ago, I really wanted to instead focus on a singular big picture chart today:


