Amazon

Friday, July 8, 2022

SPX Update

Last update discussed how INDU had made a new low on July 5 and that this might be a hint that the current bounce might not last.  Since then, SPX rallied up through both near-term resistance zones, but did find some resistance shortly before yesterday's close.  In a perfect bear world, they'd probably like to see yesterday's high hold, but in the event it doesn't, there is additional resistance in the zone between there and the June 28 high.

Beyond that, not much change from last update, except to note that Stockcharts has been deleting my annotations again, and I get tired of retyping them for every update:


So here's what the annotations said last time:


In conclusion, other than that, not much to add from last update.  Trade safe.


Wednesday, July 6, 2022

SPX and INDU: Harbinger?

Since last update, there's been another test of and bounce at support... however, INDU made a new low during that test, which might be a warning that yesterday's low is a b-wave low (meaning that low will be revisited/broken):


INDU's (unannotated) chart below:


In conclusion, on the one hand, support held again -- however, the new low in INDU is probably not what bulls wanted to see, as that can be a warning of a temporary low.  SPX, of course, did not make a new low, so this isn't crystal clear, and maybe INDU simply needed a fifth wave to wrap up its decline... but it's certainly a caution signal for bulls, at the minimum.  If the bounce in SPX continues, then watch 3845-55 and 3868-75 as potential resistance zones.  Other than that, no real change from the past couple updates.  Trade safe.

Friday, July 1, 2022

SPX and BKX: Support Does Its Thing

Since last update, SPX declined down to the "structural support zone" I noted on the near-term chart, and found some support there:


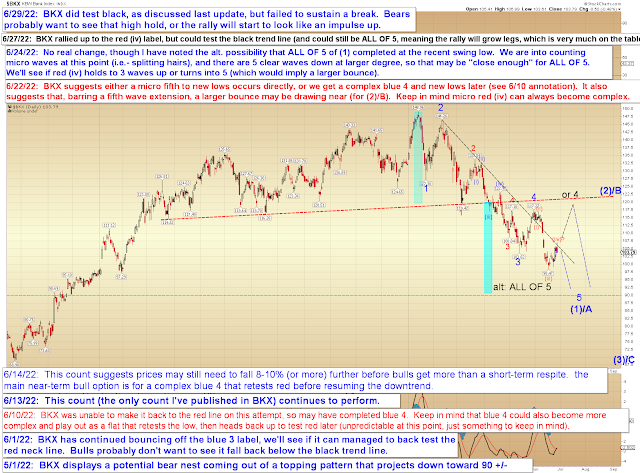
BKX declined all the way down to retest its prior swing low, and since it overlapped the start of its more recent micro wave (spell check would like it noted that it believes "microwave" is one word, as in "NEVER put your pet goldfish in the microwave!"), the high at red (iv) is not as relevant anymore and would no longer indicate an impulsive rally.  


In conclusion, bulls managed a bounce at (the zone I had previously theorized might act as) support and have so far held above the tentative key overlap, so there's no real change from last update, and if bulls keep holding that zone, they can put together a larger bounce -- if support and the (tentative) key overlap fail, then bears might have the near-term ball.  I do want to note, in case it wasn't clear for anyone, that I remain long-term bearish regardless of what happens here.  Trade safe.  Oh, and happy Fourth of July to everyone.

Wednesday, June 29, 2022

SPX, BKX, COMPQ, NYA: Next Zones to Watch

This update is better explained with charts than with words, I think, so let's jump right into it.

First up is BKX:


COMPQ was rejected right at the previously discussed blue trendline:


Next is NYA, which also shows a clear "three up" (three up is the inflection zone for a corrective ABC rally) so far:


Big picture, SPX ran a bit past the original upside target zone, but fell short of the next one (so far):


Near-term, I've noted some zones to keep an eye on:


In conclusion, last update noted that the market could have a near-term reaction here, and it did.  At this point, it's quite clear what bulls need to do and where bears might want to step aside (yesterday's high) -- and while it's not quite as crystal-clear what bears need to do (there are zones, but no "hundred-percenters"), it is worth noting that they haven't done any of it yet.  Trade safe.  


Monday, June 27, 2022

SPX, BKX, NYA: SPX ~3900 Hit

Last update noted that bears might want to show caution and called out SPX ~3900 as the next zone we'd be watching -- and SPX got there before the close of the session.  This is the first test bulls face, so we'll see how the market handles it -- but if bulls sustain a breakout here, then it would call for bears to continue to show caution and patience.


BKX rallied up to red (iv) from last update:


NYA's whipsaw was indeed a near-term warning signal:


Also, I mentioned a few days back that I was working on a longer piece, but I've decided to hold off for a minute on publishing it.  The piece was a bit of an off-the-cuff analysis on current market sentiment (which, as I've discussed, seems to consist of people who say they're bearish but are invested as if they're bullish) -- so if you asked me why I've decided to hold off, I'd say because I actually want to see a larger rally here (and my gut says that may happen) and for people to really think the "bull party" is back in full swing... at which point I will then publish the piece discussing why I think they're wrong.  It's the contrarian in me (grin).  

Anyway, in conclusion, this is a test for the market, and while there's no particular chart or fundamental that grabs me at this juncture, as I mentioned above, my gut says there's a decent chance for a larger rally here... so we'll see how the market reacts to the test of resistance, but if it starts clearing resistance zones, then I do think bears should be careful (for the time being).  If it doesn't clear, then maybe bears are still in near-term business (and SPX may react to this zone, which is presumed resistance, in either case).  Trade safe.

Friday, June 24, 2022

SPX, BKX, COMPQ: Picking Nits

The price action of the past few days suggests bulls are trying to put in a bottom of sorts, the question is whether this is just going to be a micro fourth wave, or the start of something more significant.  In today's update, we'll look at the next upside zones that may help answer that question.

Let's start with SPX:


BKX helps put the chart above into more perspective -- we can presume either BKX/SPX are working on micro red (iv), or are trying to mount a larger bounce in 2 (or a more complex larger 4 -- not functionally much different at this stage):


NYA has whipsawed its breakdown:


COMPQ is bouncing from its 50 month MA, a possibility we were alert to earlier:


A different look at COMPQ:


In conclusion, the ingredients are finally at least present for a larger bounce if bulls can clear the next upside resistance zones.  We're into the "picking nits" part of Elliott Wave analysis, where the easy money for the move (at least, for this leg of it) has already been made.  At this point, the structure could "possibly" support one more micro fifth wave lower -- but zoomed out at the larger time frames, it already has enough waves to call it "five down."  Which means this is certainly an area where bears might finally want to show some caution.  The next zone we'll be watching is the 3900+ area on SPX.  Trade safe.

Wednesday, June 22, 2022

SPX Update: One Chart to Rule Them All

Well, I have begun a longer piece, but I can already tell I'm not going to finish it in time, so this is the abridged version.  With any luck, I'll complete the longer piece for Friday or Monday.  The only thing about that is that the chart below (SPX, not BKX; second chart) inspired the longer piece, so it feels a bit naked without it, but I suppose I can always publish the chart again.  So let's start here:

The near-term charts are a bit mixed:  Some seem to suggest we may be closing in on a bounce, others seem to suggest waterfall potential; if we refer to the BKX chart below, this dichotomy makes some sense, as we appear to be in a fifth wave, and fifth waves are the final waves that complete a larger structure, thus they tend to suggest a bottom of sorts is near... but if they extend, then they waterfall.  


Presumably, SPX and BKX will track reasonably closely in structure over the next few sessions.  Personally, I'd like to see a standard fifth here (not a waterfall extension) to relieve some of the bearish sentiment and give pundits some hope before the next leg down.  So in a perfect world, that's what we'd get -- but just keep in mind the market always reserves the right to form a fifth wave extension.

While sustained trade above Tuesday's high might be viewed as a caution signal for bears (as one option would be the larger complex black "or 4" on the chart above).

Either way, due to a question I received a few days ago, I really wanted to instead focus on a singular big picture chart today:

I originally annotated the potential targets for this bear market back in August of 2021, when I was still bullish and riding the trend higher -- but I annotated it in anticipation of the bear market we now find ourselves in.  I simply want to refer back to that annotation.  Sometimes the best targets are the targets you draw when you're not in the thick of things.


In conclusion, BKX covers the near-term, but (due to a question I received on the forum, which I assume is a question some others may have as well), I did want to again highlight that this is not a correction in a larger bull market.  Meaning:  It's not going to be over next month.  Or the month after that.  It's almost certainly going to take years to unfold, so (assuming I'm correct on the wave degree, and all early indicators suggest I am) it would help to adjust one's thinking in that direction.  Even my use of the term "early" above (as in: this is still the early phase of this bear) might be taken as a hint.  Trade safe.