Amazon

Friday, June 17, 2022

SPX, NYA, COMPQ Updates

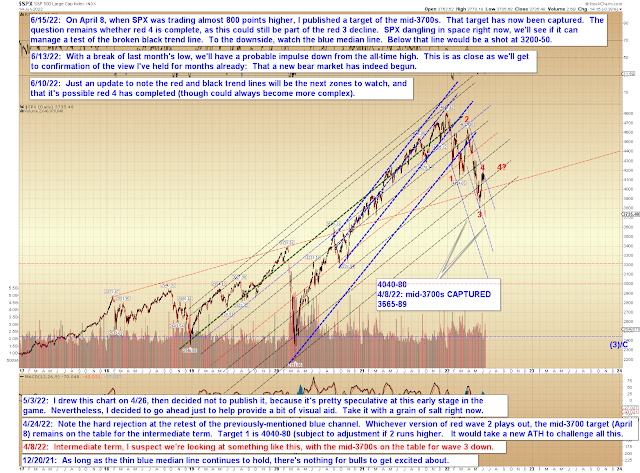
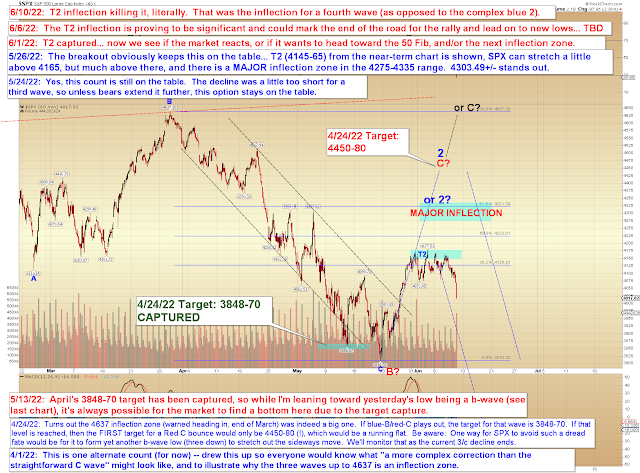
Yesterday, SPX captured its third downside target, and, as we'll see in a moment, tested potential support zones in a number of markets.  We'll also look at some possible target areas in the event support fails.

First, the legacy chart:


Next, COMPQ hit a horizontal and bounced:


NYA hit a horizonal and bounced, but is still below black:


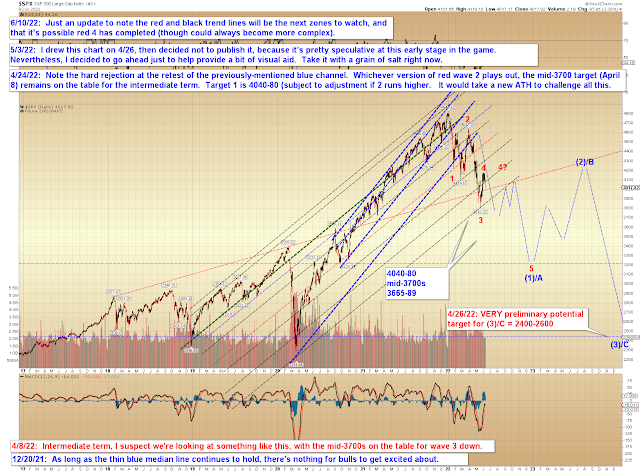
The very long term chart, for reference:


And finally, bulls haven't done much yet -- if they can't muster more, then the chart below lists some additional downside zones:


In conclusion, SPX has captured its standing primary downside targets (for now), and some old support lines were tested, so it's always possible a larger bounce could develop here -- but so far, bulls haven't done anything but retest some broken support zones.  If they cannot recover those zones, the waterfall will continue.  Trade safe.

Wednesday, June 15, 2022

SPX, NYA, BKX, COMPQ: April 8 Target Captured

Today is a Fed Day, which means the market usually grinds around waiting for the announcement, then goes crazy for a minute, then seems to settle on one direction, which is often a fake-out, then heads the other way.  Not always, of course, because that would be too predictable.  But more than half the time.

It will be interesting to see if the Fed goes with the .50 increase they've been telegraphing for weeks, or if they go with .75, given that inflation is the highest it's been since the days when the Dodge Aries K was cutting edge new car technology.  If the Fed raises .75, investors will never trust their jawboning again.

Chart-wise, first up, my back-of-the-napkin target (read: I looked at the chart and this was where it looked like the market wanted to go -- very early in a pattern, targets are best derived by relying on experience instead of calculators, for me, anyway) of "mid-3700s" was captured:


COMPQ faces an interesting test:


BKX still in the same place:


NYA, unless it's working on a WXY or something ultra-complex, will look terrifying if that black trend line fails for more than a brief moment:


And finally, in a fast-moving market like this, big picture trend lines can become more important that micro counts:


In conclusion, there are some potential support zones nearby (50 month MA in COMPQ, trend lines in other markets), so we'll see if bulls can mount any sort of bounce here.  If they can't, particularly if NYA's lower line fails, we could enter waterfall territory.  Trade safe.

Monday, June 13, 2022

SPX Update

So last Monday's top call will prove correct with the new low we'll see on the open.  


How low can it go?  Well, BKX suggests there's room to run if it wants:


Long-term, I almost prefer to watch trend lines at the moment:


US Dollar will hit its next target:


In conclusion, I began this update with what seemed like plenty of time, then lost myself in the charts and ran out of time (!).  The short version bottom line is that we appear to be in a fifth wave, which means either we drop into the old target zones and find support, or we get a fifth wave extension and crash.  Since a crash is very possible in this position, bulls should await an impulsive rally before acting aggressively.  Trade safe.

Friday, June 10, 2022

SPX and BKX Update: Now We Can Call This a Hit

On Monday, I wrote:

In conclusion, futures are indicating a gap up, but my very slight lean right now is that this will present a selling op. If SPX clears 4178, then red C is (obviously) still unfolding, though it could be in a fifth wave in that event. Short version: Unless SPX clears 4178 on increasing momentum, bears may have a solid shot here.

Today, it's obvious that the gap up toward the ~4160 zone was indeed a selling op, considering that right now futures are pointing to an SPX open around 200 points below Monday's "gap up" sell zone.  And while I hesitated to call that a hit on Wednesday, due to the complex flat pattern that developed, I can now officially say that Monday (and Wednesday, for that matter) calls were a hit.


Next, I tried to draw some trend lines on the chart below, but Stockcharts deleted them, so after 3 tries, I gave up.


After bouncing off the blue 3 label, BKX likewise shows the potential of a completed fourth wave:


Finally, this chart isn't really a projection per se, it's more of a visual aid:


In conclusion, they say "they don't ring a bell at the top," but Monday and Wednesday's updates were hopefully the next best thing for readers.  Trade safe.

Wednesday, June 8, 2022

SPX Update: Instant Replay?

So last update expected Monday morning's gap up would be sold, which was a hit, and many traders would consider that to have been a pretty good call -- but then SPX decided to get cute and failed to reach my downside targets, so I have to file last update as only a partial success (for now).  The question now is whether this is simply a more complex version of the same pattern, or if something more bullish is underway.  I tend to lean slightly toward the former, but the pattern has gotten a bit hairy, so I can't assign high confidence to that.

(note, typo:  "4130-49" should be "4030-49")


Bigger picture, we're basically in the exact same place we were last update, back up testing the top of T2 again:


In conclusion, the very near-term was easier to read last update than it is now, so we'll see how it plays.  If bulls make a slight break over 4178 and then reverse lower, we could be in a more complex 4th... if they break out and hold it, then bears have to be cautious.  But first things first, and until bulls break 4178 at all, bears still have a shot here.  Trade safe.

Monday, June 6, 2022

SPX Update

SPX didn't do much on Friday, leaving two obvious near term options on the table:  Either Friday's decline was i/a down on a new larger wave (I'm very slightly leaning toward this) or it marked wave C of a running flat (a flat that fails to break below the prior A wave low):


The T2 inflection zone has proven itself a worthy adversary for the market, having so far rejected two attempts to clear it:


In conclusion, futures are indicating a gap up, but my very slight lean right now is that this will present a selling op.  If SPX clears 4178, then red C is (obviously) still unfolding, though it could be in a fifth wave in that event.  Short version:  Unless SPX clears 4178 on increasing momentum, bears may have a solid shot here.  Trade safe.

Friday, June 3, 2022

SPX Update: Good Sir, Could You Spare Me a Label?

Since last update, SPX declined to the blue "4?" label on the first chart, hit that label and bounced (labels sometimes act as support and resistance -- sometimes when I need a few extra bucks, I'll open Stockcharts during the session and throw a quick label on a chart to create reversals.  Of course I'm kidding!) The end result is that, amazingly, there's been essentially no change from last update.  To the point that SPX might even do the exact same thing again.  4038+/- is an area of interest:


And since there's no change on that chart, there's no change on this chart:


In conclusion, SPX could have completed ALL OF C at yesterday's high, so we can't take this inflection lightly, as it could head straight on to new lows from here... but I have the sneaking suspicion we might see a repeat of the last few days ("second verse, same as the first!").  We have to be prepared for either outcome though -- such is the nature of complex corrections.  Trade safe.