Amazon

Friday, June 10, 2022

SPX and BKX Update: Now We Can Call This a Hit

On Monday, I wrote:

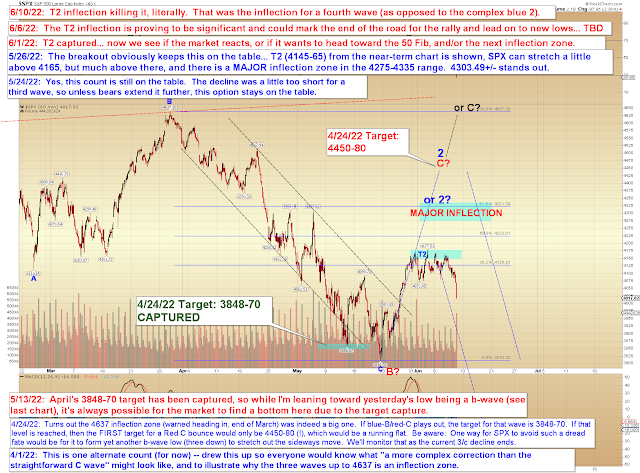
In conclusion, futures are indicating a gap up, but my very slight lean right now is that this will present a selling op. If SPX clears 4178, then red C is (obviously) still unfolding, though it could be in a fifth wave in that event. Short version: Unless SPX clears 4178 on increasing momentum, bears may have a solid shot here.

Today, it's obvious that the gap up toward the ~4160 zone was indeed a selling op, considering that right now futures are pointing to an SPX open around 200 points below Monday's "gap up" sell zone.  And while I hesitated to call that a hit on Wednesday, due to the complex flat pattern that developed, I can now officially say that Monday (and Wednesday, for that matter) calls were a hit.


Next, I tried to draw some trend lines on the chart below, but Stockcharts deleted them, so after 3 tries, I gave up.


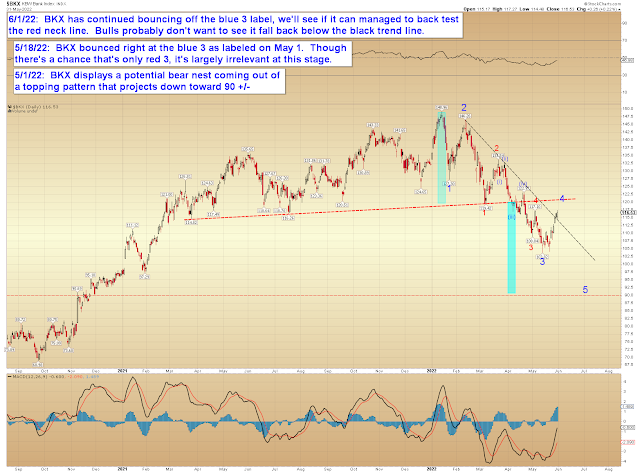
After bouncing off the blue 3 label, BKX likewise shows the potential of a completed fourth wave:


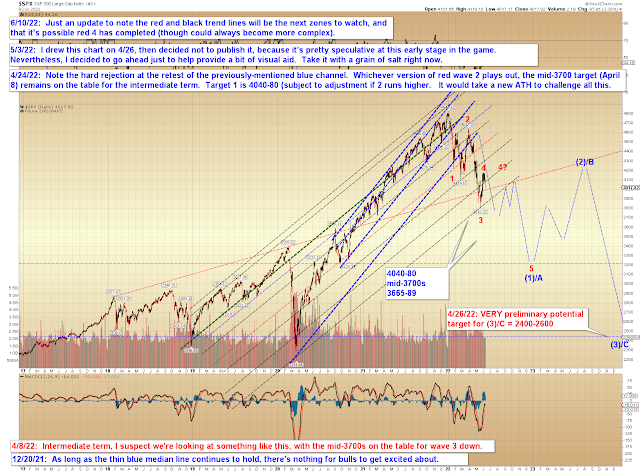
Finally, this chart isn't really a projection per se, it's more of a visual aid:


In conclusion, they say "they don't ring a bell at the top," but Monday and Wednesday's updates were hopefully the next best thing for readers.  Trade safe.

Wednesday, June 8, 2022

SPX Update: Instant Replay?

So last update expected Monday morning's gap up would be sold, which was a hit, and many traders would consider that to have been a pretty good call -- but then SPX decided to get cute and failed to reach my downside targets, so I have to file last update as only a partial success (for now).  The question now is whether this is simply a more complex version of the same pattern, or if something more bullish is underway.  I tend to lean slightly toward the former, but the pattern has gotten a bit hairy, so I can't assign high confidence to that.

(note, typo:  "4130-49" should be "4030-49")


Bigger picture, we're basically in the exact same place we were last update, back up testing the top of T2 again:


In conclusion, the very near-term was easier to read last update than it is now, so we'll see how it plays.  If bulls make a slight break over 4178 and then reverse lower, we could be in a more complex 4th... if they break out and hold it, then bears have to be cautious.  But first things first, and until bulls break 4178 at all, bears still have a shot here.  Trade safe.

Monday, June 6, 2022

SPX Update

SPX didn't do much on Friday, leaving two obvious near term options on the table:  Either Friday's decline was i/a down on a new larger wave (I'm very slightly leaning toward this) or it marked wave C of a running flat (a flat that fails to break below the prior A wave low):


The T2 inflection zone has proven itself a worthy adversary for the market, having so far rejected two attempts to clear it:


In conclusion, futures are indicating a gap up, but my very slight lean right now is that this will present a selling op.  If SPX clears 4178, then red C is (obviously) still unfolding, though it could be in a fifth wave in that event.  Short version:  Unless SPX clears 4178 on increasing momentum, bears may have a solid shot here.  Trade safe.

Friday, June 3, 2022

SPX Update: Good Sir, Could You Spare Me a Label?

Since last update, SPX declined to the blue "4?" label on the first chart, hit that label and bounced (labels sometimes act as support and resistance -- sometimes when I need a few extra bucks, I'll open Stockcharts during the session and throw a quick label on a chart to create reversals.  Of course I'm kidding!) The end result is that, amazingly, there's been essentially no change from last update.  To the point that SPX might even do the exact same thing again.  4038+/- is an area of interest:


And since there's no change on that chart, there's no change on this chart:


In conclusion, SPX could have completed ALL OF C at yesterday's high, so we can't take this inflection lightly, as it could head straight on to new lows from here... but I have the sneaking suspicion we might see a repeat of the last few days ("second verse, same as the first!").  We have to be prepared for either outcome though -- such is the nature of complex corrections.  Trade safe.

Wednesday, June 1, 2022

SPX and BKX: Target 2 Captured

Since last update, SPX captured Target 2, good for 163+ points (T2 was an "if=then" target that became active above 3982).  That's the good news.  The bad news is that this is an inflection zone on a (presumed) corrective wave, and corrective waves are much more difficult to anticipate than motive waves.  Corrective waves have a million different options, which means the high probability portion of this trade is over, unless, of course, the market reverses and heads lower directly.


Bigger picture, we have a sense of some of the different options the market has here:


It's worth mentioning that BKX might be trying to retest the broken neckline -- if that's the case, then SPX may find a way to stretch a bit higher.  Of course, there's no law that says BKX needs to test that line, it's just a common "return to the scene of the crime" reaction -- so not a given here, either.


In conclusion, SPX has captured Target 2, which is also a pretty significant inflection zone (plus a little, if blue 4 (first chart) becomes more complex).  If all it wanted was a simple ABC rally, then it's in the ballpark of enough waves up for that to complete (and if that's a complete ABC, then, of course, it means SPX is headed to new lows from here).  We'll see how it reacts next.  Trade safe.

Friday, May 27, 2022

SPX Update: First Upside Target Captured, and One for the Bulls

Bulls did their thing yesterday and broke out of the crash channel.  They then captured the first if/then upside target.  Given the wave structure, it looks reasonable to assume the next minor inflection will be reached to the upside (that inflection marks the potential where a complex correction could develop).  Assuming no complex correction, then red C looks reasonable (4145-65), so this has the makings of a decent rally:


Next, let's take this out one level further and see what happens in the event T2 is materially exceeded:


Bigger picture, the preferred count believes we're either working on a fourth wave or a second wave:


Finally, I mentioned this on Wednesday, so I do want to show it in the sake of balance, and because my conscience requires it.  This is the long-term alternate count (bullish), so I'm not favoring this -- but I'm not so blinded by my own bias that I can entirely pretend it doesn't exist.  Rest assured that this is in the back of my mind, so if we start to see any signs that it may be developing, I'll pass them on to you.


In conclusion, bulls have done what they've needed to so far to put together a (presumed) bear market rally, so I currently expect SPX will head higher for a time.  We have the next upside target zones to watch, so we'll wait for those and take it from there.  Enjoy the long weekend, and trade safe.

Tuesday, May 24, 2022

SPX and COMPQ: Yes, But They Really Haven't Done Anything Yet

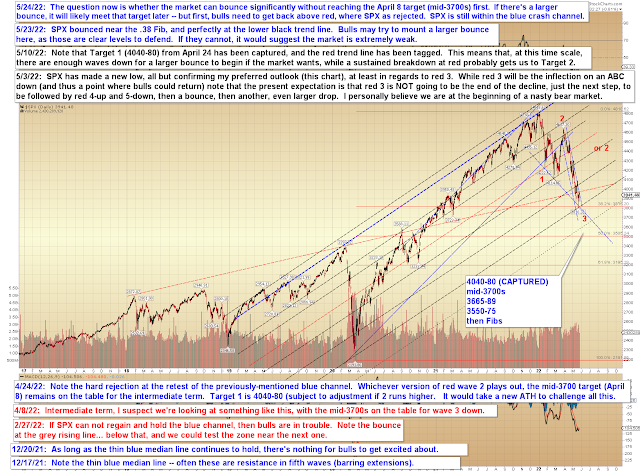
So we're still within challenging price territory, where SPX has many short-term options to choose from, and it simply isn't clear yet which option it wants.  Remember back on April 8, when the livin' was easy and the chart below was my "all roads lead to this" chart?

Of course, it wasn't so easy for a lot of traders, since many of them thought we might still make new all-time highs -- but I was not among them and I published exactly zero alternate counts to this projection:


The challenge now is that, while we didn't quite make it to the mid-3700s, we got awfully darn close.  Close enough to say that the above projection has basically played out -- and as many readers know, once a projection plays out, the market enters an inflection zone, where it has multiple options for its next path.  And during such times, I have to sit back and observe for a minute until the market more clearly declares its next intentions, at which point I can make a new, more concrete projection again.

Let's take a look at that chart as it sits now:


First, I want to mention that in the event I've got this wrong and we have not begun a new long-term bear market, we are in the zone of an inflection for three waves down (i.e.- ABC) from the all-time high, so if you're of the bullish persuasion, this is where you'd start accumulating longs in anticipation that this was "just a correction" and that the market is headed back up.  

I have stated my reasons multiple times as to why I'm not favoring that outcome, but it is technically possible, and I'm not infallible.

So with that notification out of the way, the first thing we notice on the chart above is that SPX is still within the blue crash channel -- so that's the first thing bulls need to clear (it lines up reasonably well with red resistance, too).  The second thing we notice is that it's a bit short for a third wave, which suggests that either the third wave is still unfolding (perhaps we're in a micro fourth of that third), or it's another nested first wave, or (and we're all hoping for this) it's the good ol' flat we discussed at length previously (below):


Next, let's take a look at the very near-term options:


As we see on that chart, near-term, bulls need to clear 3982, which was close enough to the inflection that the inflection is still active.

COMPQ's long-term chart is interesting:


Finally, the 10,000 foot view of the very long term:


In conclusion, bulls managed a bounce at obvious support, but they still have their work cut out for them and have yet to so much as break out of the established crash channel.  That's the first thing they need to accomplish to gain a crack at a larger bounce; if they do, then we have the next immediate targets on the near-term chart (4th chart).  If they don't, then we have the larger targets on the intermediate chart to watch (2nd chart).  Things will become clearer again soon enough.  Trade safe.