Amazon

Monday, May 23, 2022

SPX Update: Obvious Support

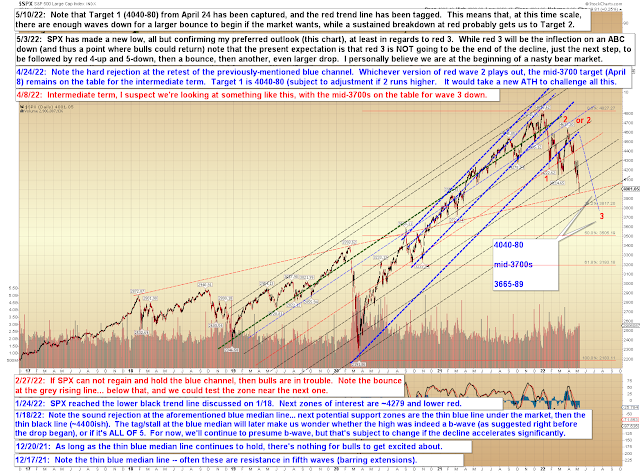
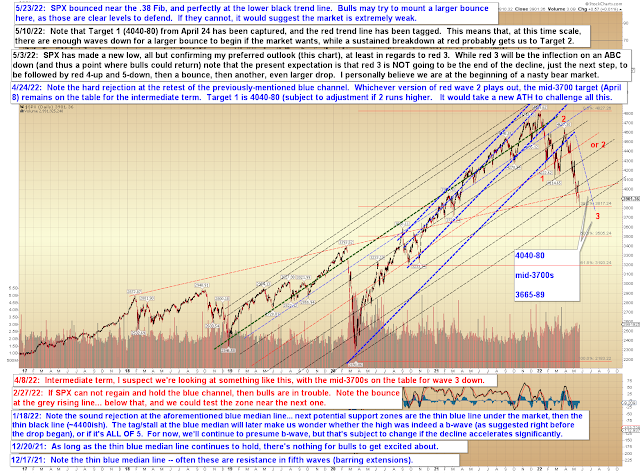
On Friday, SPX declined to, and bounced from, the lower black trend line on the big picture chart I've been publishing for months:


That zone marks a clear defensible level for bulls (in addition to the chart above, I called it out ahead of time in the forum as a support level), so they need to do something with it.  In the event they can't hold it for longer than a day or two, it would bode poorly for them.

Here, I'd like to reprint something I wrote in the forum over the weekend:

Nothing approaching panic selling yet, and didn't even overshoot the trend line a little, just bottomed right there perfectly. This market is still complacent, regardless of most of the bear talk. As I said the other day, I think most people are "oh no, a correction" bearish, not "OMG a genuine bear market!" bearish. So far, anyway. Bear markets are terrifying, as anyone who traded 2008 and 2001 will attest. There's no fear in this market yet. 

But I wouldn't be shocked if it takes some time. In 2008, after the first 20% decline, there was a multi-month bounce before the real selling started. Not sure if that will happen here (in this phase of bear markets, the key understanding that puts you ahead of the crowd isn't "exactly when will it go lower" but simply understanding that it is now a bear market, which the majority don't accept until the middle of the first big third wave down), but it's certainly within the realm of possibility:


Near-term, the first zone bulls have to clear is noted below in blue:


In conclusion, bulls bounced right from an obvious support zone, so they may be able to muster a larger bounce from here.  If they can clear resistance on the chart above, then we'll keep an eye on the expanded flat (Red ABC) shown on that chart as an option, and then take it from there.  If they can't even clear the first inflection, then they may have bigger problems directly.  Trade safe.

Friday, May 20, 2022

SPX Update

Last update suggested that the near-term had become a pain in the neck, and the market immediately tanked on that alarming realization.  While there's been a deep retrace, the count below is unaffected by that and still remains on the table, at least for the moment:


The near-term is likewise thus unchanged.  Keep in mind that much below the 3848 target zone and not only does the "Bear 5" become possible, but the extended fifth discussed previously would remain possible (see 5/10 annotation, at bottom).


In conclusion, if bulls continue holding the lower end of the target zone (3848), then the larger expanded flat remains on the table (though the inability of the market to break out of rising resistance yesterday needs to change; yesterday's action was not particularly bullish).  If SPX sustains a breakdown at 3848, then we probably have to presume that "Bear:5" is underway.  If it sustains a breakdown on increasing momentum, then we could very well be seeing the extended fifth that was discussed previously.  Trade safe.

Wednesday, May 18, 2022

SPX Update: Are We Just Being Stupid Here? No Really

I'll be frank:  I'm a little annoyed with the current market.  After calling out the 3848-70 target zone way back on April 24, the market dropped down into that zone and then, by virtue of forming a less-than-clean (possible) fifth wave, still managed to "catch me looking" there.  Which is ridiculous, given that I've mentioned that zone half a dozen times since April 24.  But such is the way of the market sometimes, I suppose.

Anyway, this is how we now find ourselves wrestling to determine whether this is:

1.  The count nobody else saw that we've been watching for a month straight (as a slight odds-on favorite) which just happened to bounce right from the center of its very narrow target zone versus 
2.  The "well, that low kinda looked like a b-wave" count that only appeared the same day as the low, and which just about everyone sees.

(smacks forehead)


I mean, when I look at that narrow target zone drawn to scale on the chart above, I just have to shake my head.

But hey, it wouldn't be trading if everything was spelled out for us all the time (because if it was, then we'd all only need to place like half a dozen more trades leveraged to the hilt and could then retire as billionaires), so here's the more immediately bearish option.  Though I have to say, when I chart it out at the micro level (as I did here), it's a little challenging to resolve the rally as a completed C of 4 -- it looks more like a 1/A with an ongoing complex 2/B correction in progress.


And finally, BXK reached its next target zone:


In conclusion, yesterday's high looks like a make-or-break for near-term bears.  If they can hold the market below that, then the b-wave low remains possible, so yesterday's high is the final inflection for that option.  If you're more bullishly inclined, then the second chart highlights a couple of near-term inflection zones (though not the "only" inflection zones) going the other way.  Both counts point down for the very near-term, but the bull count will hold this month's low and rally again while the bear count just continues lower.  Bigger picture, both counts are ultimately still bearish.  Trade safe.

Monday, May 16, 2022

SPX Update: Not Even the End of the Beginning

Let's talk about the bigger elephant in the room:  In my estimation, people who still believe the Fed will reverse course aren't paying enough attention.  The Fed has made it abundantly clear that their number one goal right now is price stability, which can only be achieved by taming inflation.  In order to tame inflation, the Fed is going to continue to hike rates and feed volatility.  The simplest way to understand this is to recognize that the Fed's goal is to achieve, essentially, a "negative wealth effect."  

Which means asset prices must fall.  To the Fed's current mindset, the fall of asset prices is a feature, not a bug.

The Fed is not worried with the S&P below 4000 -- the Fed wants the S&P below 4000.  To achieve its goals in this environment, it needs SPX below 4000.  And well below 4000.

QE and government "stimulus" spending created runaway inflation; to reverse inflation, the Fed must reverse the effects of QE and government spending.  The Fed needs demand to weaken and supply to increase, and in order to do that, the Fed must drain the excess liquidity that was poured into the market and the economy.

Put simply:  The Fed needs to destroy wealth to tame inflation.  And, more importantly, it seems committed to that goal.

Some bulls have argued that we won't see a recession because household and business balance sheets remain strong.  But bulls are stopping their analysis too soon and aren't taking this to its logical conclusion:  The Fed cannot tame demand if balance sheets remain strong.  Which means that in order to achieve its goals, the Fed needs balance sheets to become weak, so destroying balance sheets becomes part of the plan.  "Balance sheets remain strong" is thus not an argument that "there will be no recession," it is instead an argument the Fed will continue pushing the market down.

By all current appearances, it seems the Fed only reaches its goals by continuing to feed volatility and destroying wealth until the economy is in recession.  Thus, the Fed is not going to reverse course when the economy starts to struggle (unless inflation has abated), because they currently view a struggling economy as necessary to tame inflation.  And the Fed won't bail the market out as it heads lower, because the Fed wants the market lower.

Needless to say, this is not the same environment the market faced during the 13+ year bull; it is the complete inverse.  Bulls have not yet come to terms with this new reality.  Just as many bears struggled back in 2012 and 2013 with accepting the reality that Bernanke's Fed was committed to reflating every bubble it could, bulls will now suffer the same fate, in reverse.  With every dip, they will assume the Fed is waiting just around the corner to again bail the market out.  And why wouldn't they assume that?  After all, that's what happened for the past 13 years.

But the Fed will not bail the market out.  Not this time.  At least not yet.  

My personal theory is that the Fed won't bail out the market until it's too late and too much damage has already been done.  I base this speculation largely on the charts, but even if I had no charts, I would probably speculate the same thing, because the Fed always overshoots, in both directions.  Thus, I suspect that by the time the Fed tries to reverse course, it will be too late to stop several large entities from collapsing under the pressure (the market is not ready for this environment, and most humans do not adapt to change quickly enough to make the adjustments they will need to make to save their organizations).  

We're already seeing some early hints of this type of trouble, and things haven't even gotten rolling yet.  As one example, the fate of El Salvador is tied to Bitcoin; and when BTC tanked recently, El Salvador proudly proclaimed they had "bought the dip" (they did this north of $30K; and again, this is symptomatic of the ongoing bull market mentality -- you "buy the dip" in bull markets; you "sell the rip" in bear markets).  Which means that, down the road, as the Fed continues draining, Bitcoin will continue to tank -- and eventually El Salvador may end up defaulting on its debt.  What ripple effects will that have?

Surely we're also going to see several other collapses along the way as well.  What consequences will ensue?  One major collapse often begets another.

At some point, the dominoes will start to fall on their own, and the Fed will not have enough firepower to stop the chain reaction.  And possibly not enough firepower to save the entire system, especially if there are other "unforeseen" events that enter into the equation (we've talked about some of these previously) to overpower the Fed's goodwill at precisely the wrong time.  

That's my speculation at this moment, anyway, based on the Fed's stated goals and on the charts.  

So I think the Fed wants a recession right now, and that's why they've lit this fuse -- but it's ultimately going to spiral out of their control, and things will collapse farther and (at some point) faster, than the Fed wants.

And that's when the Fed's lit fuse finally meets the rubber road less traveled (or however that cliche goes), and it all blows up. 

Bulls are not seeing this because they're used to the "Fed put," and after 13+ years, a fair percentage have probably never even traded without it.  They are conditioned, like Pavlov's dogs, to buy the dip every time a bell rings (although if memory serves, Pavlov's dogs' dip was guacamole, and they actually ate it).  Bulls have no idea what they're in for.  Even many bears are not seeing this clearly, for the same reasons.  In my estimation, even most who are bearish are not nearly bearish enough.  We discussed this a bit on the forum, but traders and investors are still thinking in terms of bull market corrections, not in terms of true bear markets.  (That's why they haven't really started pulling funds out yet!)  Many are acting like, "Oh, two legs down, cool!  All good now, the market will be 'back to normal' in no time!" 

That's not how it's going to play out this time around.  We're still just at the beginning of the carnage, when many investors are thinking this is getting close to the end.

But then, that's sort of how it needs to be right now.  Unfortunately.  

Winston Churchill once said: "This is not the end.  It is not even the beginning of the end.  But it is, perhaps, the end of the beginning."

In my view, that assessment would be too optimistic to describe the current market.

*****

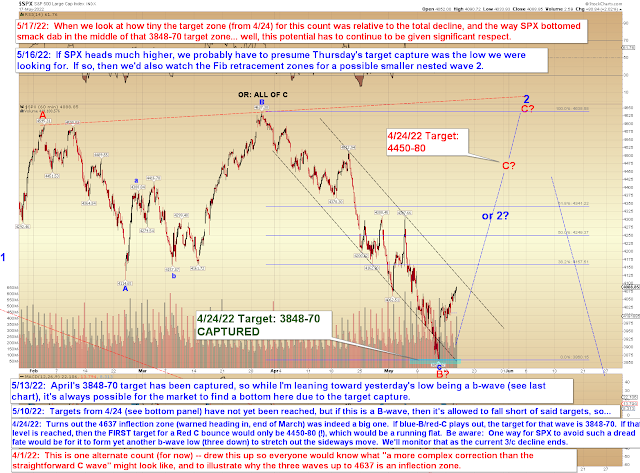
Chart-wise, SPX decided to capture April's target zone, then make things complicated with a potential b-wave low, since things had been too easy for us for too long.  Last update hypothesized a level, but wave-structure-wise, SPX probably needs to stall around here to keep the potential b-wave on the table:


It would have been much easier if SPX had not bounced from smack in the middle of April's target zone:


In conclusion, I remain bearish on the bigger picture, now we're waiting for the market to announce whether this will become a more tradeable bounce, or if it's just a very-short-term pause.  Trade safe.
Friday, May 13, 2022

SPX Update: April Target Captured

Yesterday, SPX captured one of its "all roads lead lower" targets from April, but did so with what may have been a b-wave:

(note: black "alt: 5" should be where blue b is)


So the chart above suggests that another low is still needed, but since April's target was captured, it's a little trickier than it might otherwise be:


In conclusion, if yesterday's low was it, then it will rally strongly for a tradeable bounce from here; if the low was a b-wave, then a rally toward 3995-4015 wouldn't be unusual (though it does not need to reach that zone).  I'm leaning toward the b-wave low (meaning there will be a reversal back to retest/break the low) for now, but f SPX sustains a breakout above 4015, then the b-wave will become suspect.  Trade safe.

Wednesday, May 11, 2022

SPX Update

So it seems inflation is still rising (despite the headline numbers suggesting otherwise, core inflation actually rose at double the rate of March), which is absolutely shocking, given the Fed bothered to raise rates by one-millionth of one tenth of one percent.  Plus Powell and Biden have both been glancing sternly at inflation for some time, yet it seems inflation has not been cowed and has continued brazenly onward.  Is there no stopping this "inflation"?  What possible other options are there?

Sigh.  This is what happens when Keynesianism (or any other theory) becomes entrenched in our ruling class.  Eventually there are no voices left to say, "Hey, maybe we're a little off on this."  It just become an echo chamber.  I haven't even checked lately, but are we still blaming "Putin"?  Because that would be pretty funny, inasmuch as oil has since frequently traded below the price it was on the first day of Russia's invasion, and did so again this week.  (Plus, of course, inflation began its current trend well before the invasion.)

Anyway, don't get me going on all this.  Let's get right to the charts.  Blue 4 was confirmed since last update:


In a perfect world, SPX looks like it probably needs another low to be a complete wave, though (please read the entire annotation here):


If we bounce immediately, then we're probably working on the smaller-scale expanded flat that shown above, and not on the larger expanded flat we've been discussing as an option (below); at least, that would be my first instinct, due to the near-term chart appearing to need another wave down:


Bigger picture, the first downside target has been captured:


In conclusion, if SPX does not make a new low in short order, then we may be working on the smaller expanded flat 4th shown in chart two.  If it does make a new low directly, then bulls will want to be cautious if there's any acceleration, as this is a decent setup for an extended fifth.  Also, please keep in mind that if the fifth does not extend, then the fifth wave simply completes the larger wave for this leg of the decline, and that leads to a decent-sized corrective bounce.  Trade safe.

Monday, May 9, 2022

SPX Update: No Material Change

I spent the weekend working on a longer piece about Supercycle declines, but it's not ready for primetime yet, so short and sweet update today, since there's no material change from Friday.

First up, the near-term chart:


The expanded flat count,, which would continue to behave in a similar fashion to the count above at this point:


And the bigger picture, which likewise remains unchanged:


Continue to keep in mind that an extended fifth remains possible with SPX in the current position, so if there's a sustained breakdown, draw your crash channels and don't even think about covering until there's a sustained breakout above that channel (not trading advice).  Trade safe.