Amazon

Friday, May 6, 2022

SPX and TLT Both Capture Their Near-term Targets

On Wednesday, the Federal Reserve announced that they're going to fight inflation as slowly as humanly possible and will limit themselves to 0.50 rate increases, with no thought of 0.75 increases even if inflation reaches 2000% and we begin stapling dollar bills together to use as notepads because they're cheaper than actual notepads.  Because the labor market is just that strong (wow, so strong!  It's almost hard to look at without protective eyewear) or something.

The market initially decided this was bullish, because, hey! only a 0.50 rate increase.  Then the market realized that nothing about this environment is bullish and gave it all back on Thursday.

Or it was just blue 4 in action.  You decide:


In other news, TLT reached its next downside target yesterday, testing the lower blue trend line before coming up off the day's lows:


An interesting scenario here might be for the stock market to continue dropping in blue 5, which could maybe give TLT a little boost to retest the broken black lines, as originally suggested on April 19.  Assuming any kind of correlation between stocks and bonds still exists over even short time horizons.

SPX does still have the option for a super complex flat, but as noted Tuesday/Wednesday on the chart below, even this option would look better with another new low:


Big picture, still no change:


In conclusion, Wednesday and Thursday performed right in line with the expectations of blue 4; soon we'll find out if bulls have it in them to make that wave more complex, or if that was all she wrote and we're straight on to 5.  Also, I feel like I should mention again that this would be a perfectly normal place for a fifth wave extension -- and if that were to happen, then later today or Monday could see a waterfall.  Trade safe.

Wednesday, May 4, 2022

SPX Update: Preferred Bear View Vindicated as SPX Makes New Yearly Low

Something significant happened since last update:  SPX made a new yearly low.  This is significant because, for the past few months, I've been insisting that a bear market has already begun -- and this new yearly low is as close to "confirmation" as we're going to get at this stage.

Let's look at the intermediate chart to understand why:


The first point is that this new low obviously removes any chance that 4114 was somehow "the end of the bear" (looking at you, Jim Cramer).  Second, it's now pretty unlikely that SPX can bottom immediately without at least needing to return to make lower prices later (this would be in the event that it doesn't make lower prices directly).  If it does start a larger bounce immediately (possible -- see forthcoming near-term charts), then it would, by all appearances, leave an incomplete wave at the low here and thus need to return to current levels to resolve that.

Now, even though I'm not currently publishing any intermediate or long-term alternate counts (because I'm viewing them as heavy underdogs), it's impossible to be 100% certain in this gig, so for sake of reference:  The bull option would be for the current red 3 to be red C, which would complete the decline and rally up to new highs.  At the risk of being wrong, I'll go on record here to say I think that's very unlikely (if my views on that weren't already obvious, given that I haven't published even so much as a hint of an alternate intermediate bull count in months).

I do find it interesting that, supposedly, sentiment is "as bearish as it was in 2008."  Having been a very active trader in 2008, I can say that's complete garbage.  In 2008, even bears were absolutely terrified that the entire system was on the verge of imploding.  I don't see anything approaching that level of fear right now.  To the contrary:  Plenty of people are still touting the bull case.  Plenty of people are saying things like, "Well, maybe if you were lucky enough to sell a few months ago..." (which we were, because we're just that "lucky") "then you should stay in cash, but otherwise, it's impossible to time the market and yada yada yada, so stay long and strong!"

Yep, "impossible to time the market."  That's how we saw this top coming two years away.

For the last couple months, I've likewise heard plenty of people calling a "bottom" in the bond market, but it continued falling anyway.

The fact is:  Most people are just not prepared for what's coming.  Even most who are leaning bearish are not even in the ballpark of understanding what's coming if the Supercycle has in fact topped.  Some are even speculating that the Fed will "let" it drop a little more, then step up with QE291 or whatever, and again bail the market out.  Maybe they will -- but I suspect this faith in Fed Omnipotence is finally misplaced.  Certainly I'll revisit my present assumptions if we ever need to, but from what I can see from here, the market's future looks darker than it has in a long time.

This bull, and even bear, complacency is to be expected after a ~13 year bull run, but it tells me bearish sentiment just isn't as bad as the numbers suggest.  And it is most definitely nothing like 2008/2009.  When people start assuming the Fed is completely powerless and the system is irreparably broken -- when every pundit you see on TV is sobbing uncontrollably during commercial breaks -- then it will be 2008-09 sentiment.

Anyway, let's take a look at one option for the bigger picture -- but do please take this with a grain of salt right now:


So big picture, I remain bearish.  But near-term, the market always has options, so let's take a look at those.  This chart has outlined the expanded flat since April 1, but expanded flats can tack on middle waves and run sideways much longer than is reasonable -- and they stink, because whether they will do that or not is completely unpredictable.


The next chart focuses more on the idea that ALL OF C completed last month.  This count could see things get ugly more immediately.


Everyone no doubt wants to know which of those near-term options I'm favoring, and the answer is:  Yuck.  I mean, you're asking me to predict out of multiple largely unpredictable options here... but if I had to go, say 51% to 49%, I'd probably put the 51% lean toward some iteration of the expanded flat on the first chart, just because it would be the most confusing to the market, and would give bulls more hope and give bears more fear, and because I wasn't entirely crazy about the "resolution" it reached on the upside.

So, in conclusion, the big picture remains bearish -- but if they want max confusion over the near-term, they could opt for some version of the expanded flat... however, I don't have enough confidence in that option yet (currently) to grant that the full weight of a "predication" per se.  Trade safe.

Monday, May 2, 2022

SPX Update: Target 4 Captured

Seems like a good day to let the charts do most of the talking.  First up, Target 4 was captured on Friday:


Next, the old "alternate" continues to look perfectly reasonable:


Next, this remains the preferred intermediate outcome:


Finally, BKX seems to add confidence to the preferred outlook:


In conclusion, other than Target 4 being captured, no material change, and the old alternate remains the leader.  Trade safe.

Friday, April 29, 2022

SPX Update: 7.62 mm Full Metal Jacket

Ya' know, on Wednesday, I almost announced that I would take Friday off, on account that Thursday was my wife's birthday (which meant I couldn't get to bed at the stupidly-early hour I need to here in Hawaii, in order to be awake at 2:30ish a.m.) but instead decided to pull a Full Metal Jacket and say to myself, "I can hack!"  But as fate would have it, I could not, in fact, hack, and I ended up getting off to a "late" start here, where it's currently the late-riser lazy-person hour of 3:35 a.m. -- so just two charts this morning.

The big picture is unchanged:


Near-term, SPX could have completed the dreaded fourth wave yesterday, but fourth waves are everyone's nightmare, so it can always become more complex:


I noted on Wednesday that the T3 target zone capture was also an inflection point. and we did end up getting a bounce there, but be aware if SPX manages to sustain a breakout over yesterday's high without breaking below 4188 first, then bears might want to be cautious, as there are still options (if those conditions are met) for larger complex rallies.  Trsde safe.

Wednesday, April 27, 2022

SPX Update: Target 3 Captured

Yesterday, news broke that Deutsche Bank has apparently been reading over my shoulder, as they suddenly changed their prediction from a minor recession to a major recession, which they now say will be "worse than expected."  To which I say, speak for yourselves, Deutsche Bank.

In other news, SPX captured Target 3 (4170-85):


As with all target zones, that zone is also something of an inflection.  Everyone wants to know if the diagonal option is dead yet, and the thing is, while it's on life support, from a technical standpoint, it won't die until the low at 4114 is broken.

No change to the intermediate picture, which remains more clear than the short-term:


And finally, the old alternate, which has continued to gain traction:


In conclusion, no real change from the past few updates, other than to note the successful capture of Target 3.  Trade safe.

Monday, April 25, 2022

SPX Update: Target 1 Captured

On Friday, SPX captured Target 1 -- in after-hours trade, it then kept going.  In overnight trade, it captured the cash equivalent of Target 2.

Let's start with the intermediate term, because this projection is something of an "all roads lead to this."  In other words, while the market has a number of options over the near-term, the only thing that can kick this off the table is a new all-time-high.


Intermediate term patterns are generally much easier to predict than day-by-day patterns, as the market always has a million and one ways to get where it's eventually going.  So if you're confused by the near-term options below, then just refer back to the chart above for clarity.

First up, the used-to-be-alternate count:


Next, the near-term chart that shows the diagonal still in play (for now, meaning as of Sunday night when I drew the chart and am writing this), and since the e-mini futures have captured Target 2 in overnight trade, I added targets 3/4 in the event SPX sustains trade below T2:

(Also: There are two "T3" labels.  The second "T3" should be labeled "T4" under the traditional guidelines of the Arabic numeral system.  "T3" twice is obviously a typo.  The first T3 is also supposed to be 4170-85, not 4270-85.  My proofreader has been sacked.)


In conclusion, while there are still numerous options for the near term, the intermediate term chart and the mid-3700s target zone from April 8 helps clear the noise.  Trade safe.

Friday, April 22, 2022

SPX Update: More Like It

More lagging "leading" fundamental indicators were announced as ugly yesterday, and the market reacted.  I suspect this will continue to happen as stocks get caught up with bonds ("smart money" -- but not smart enough to get out of bonds back in December, apparently):

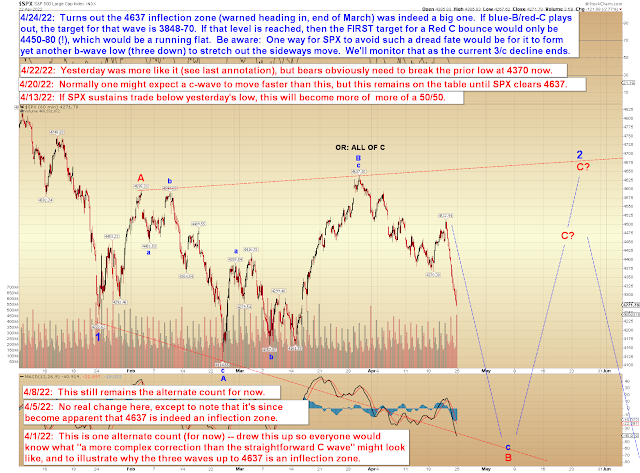
(NOTE:  Typo:  T1 should have a 42 handle, not a 43 handle; 4275-85)


Bigger picture, the idea of a retest/break of 4114 probably has the edge:


In conclusion, yesterday's decline behaved more in line with the previously-projected wave counts, so we'll see how this goes.  Trade safe.