Amazon

Friday, April 8, 2022

Some Big Names Join Us on the Bear Side, and a Look at the Intermediate Term

Former Fed President (NY) Bill Dudley now says that the Fed may have to "shock" the market and "inflict more losses on stock and bond investors than it has so far" in order to bring down inflation.

"One way or another, to get inflation under control, the Fed will need to push bond yields high and stock prices lower," Dudley said.

A couple days before that, Deutsche Bank became the first major bank to forecast a U.S. recession.  They're currently predicting a "moderate" recession, which is a recession that only impacts political centrists.  (Personally, I suspect we'll get a more radical recession, so moderates may be safer, relatively-speaking.)  Deutsche Bank opined that the U.S. economy will take a “major hit from the extra Federal Reserve tightening by late next year and early 2024,” concurrent with “two negative quarters of growth and a more than 1.5% rise in the U.S. unemployment rate.”

Former Fed Governor Lawrence Linsday, who's famous for having "LL" embroidered on every damn thing he owns, predicted on Monday that the US will fall into recession as soon as this summer.  (I suspect this is closest to correct; I think we get there sooner rather than later.  Late 2023 seems too far off.)

So.  It seems that the cows are finally coming home to roost, and it's nice to see some big names are only a few months behind us in anticipating a longer-term bearish outlook.  On December 1, 2020, I wrote:

...the fifth wave is the final wave of a move -- which, now that we're finally getting into a potentially-complete wave structure, means we're likely approaching the end of the 12+ year bull market.  

*** 

On the next chart, we'll look at a signal to watch that could tell us if the fifth wave of this fifth wave is going to extend. Thus, we can reasonably presume the fifth wave is ending here if that signal does NOT materialize.


And here's that chart (as published December 1):


As I've said for years:  The charts lead the news.  And, as I've also said for years, it really makes no sense that Goldman Sachs isn't paying me an 8-figure annual salary (plus bonuses).  Speaking of, the folks at Goldman are currently putting the odds of a 2024 recession at only 35%.  Very optimistic, GS, very optimistic.

Anyway, it's interesting to see some big names finally jumping on board -- assuming we are where we think we are, that will continue to happen more and more.  Let's get to the current charts.  

The preferred count captured and slightly exceeded its fourth wave target:


The alternate count remains the alternate:


While intermediate term, I suspect we're ultimately headed toward the mid-3700s:


In conclusion, no real change to the charts, but interesting that the rest of the world seems to be gradually waking up to the bear potentials.  Trade safe.

Wednesday, April 6, 2022

SPX Update: SPX Behaving Well, and One More Argument for the Decline of Western Civilization

Last update gave a "rough sketch" of the preferred count, and that option is in the process of playing out:


If there's a sustained violation of the KO zone, then we'll have to consider the alternate count (below), though bulls will still have near-term options (such as the ending diagonal mentioned on the chart above):


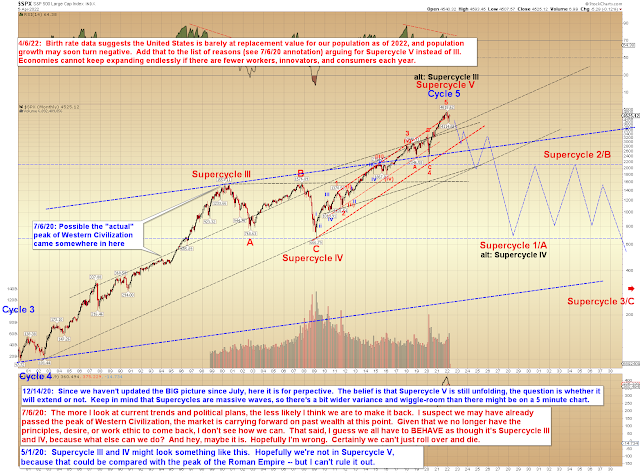
Back in 2020, when we were still anticipating that the Supercycle rally had farther to go, I gave some of my reasons for why I had begun leaning toward that rally as Supercycle V instead of Supercycle III.  A few months after publishing those reasons, it also dawned on me that America's falling birth rates could be another contributing factor to SC V, but I haven't mentioned that here since then... so I figured "why not finally mention it today?"  It's something I've been meaning to mention for a while, and no time like the present, right?


In conclusion, near-term, things have been going as expected so far; we'll see if bulls can hold the KO zone and take it from there in the next update.  Trade safe.

Monday, April 4, 2022

SPX Update

No change from last update, though I did add a "rough sketch" of one option for the preferred fourth wave (the market has many options during fourth waves, so take this with a grain of salt):


The first alternate count remains unchanged:


In conclusion, the market didn't do much on Friday, so not much to add to Friday's thoughts yet.  Trade safe.

Friday, April 1, 2022

SPX Update: April Fool's?

Last update noted that Red 5 could end at any time, and it ended right there.  Let's get right to the charts.  First up is the straightforward C-wave we've been discussing for a while, but after that, I'm going to show an alternate count:


I noted back on March 23 that this zone would be an inflection point for more complex options, so the next chart shows one option the market has if, instead of the C-wave, it wants to get really wild:


Big picture, no change since December:


In conclusion, the market has followed the preferred count right up into the anticipated inflection zone.  It does have options here, but for now, we'll presume it wants the simplest one.  That said, as the second chart shows, it's not a bad idea for traders to stay on their toes near this (or any) inflection zone.  Trade safe.

Wednesday, March 30, 2022

SPX Update: Red 5, Standing By

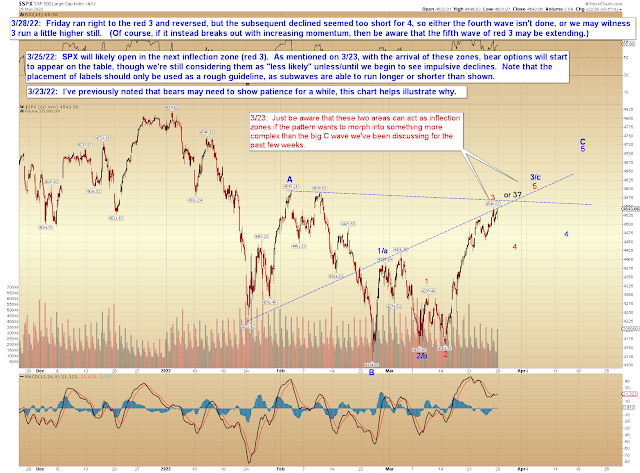
The rally in SPX has continued virtually unabated, so I'm glad we've maintained our bullish stance.  Yesterday, SPX also captured the 4595 target, first mentioned on February 25:


On the hourly chart, the pattern requires that we at least consider the possibility that red 4 was truncated.  The other option, which would be more bullish, would be that we haven't even seen red 4 yet.  For now, I'm going to favor the former option, but will remain open to the market's input, as always.


In conclusion, ideally, we'd see the larger blue 4 show up resonably soon, but do keep in mind that blue 3/c is something of an inflection point (in the event of more complex patterns than the simple blue C wave as shown above), so a larger correction isn't entirely outside the realm of possibility.  Trade safe.

Monday, March 28, 2022

SPX and Food Supply Update

Last update maintained the short-term bullish stance we've held for the past week-plus, but we still remain in the ballpark where red 3 of blue 3 of the presumed C-wave rally could peak, which will then send the market into a corrective fourth wave -- ideally afterwards, it will rally again to complete blue 3 of bull C, then correct again, then rally one last time to wrap up the corrective wave C of a larger expanded flat correction.


After that, presuming that read is correct, things will start to get ugly -- potentially very, very ugly.  Until then (or until we have reason to think the presumed wave C might be cut short, at least), I continue to believe bears would be wise to be patient.  The equities market needs a last hurrah.  If the rally does indeed continue, bears should view it as an opportunity, not a source of frustration. 

Just as bull markets are said to "climb a wall of worry," bear markets are described as "sliding down a slope of hope."  Especially in the early stages of a bear, the market does not believe itself to be in a bear market, and there have to be rallies along the way for investors to maintain hope.  In the final analysis, bear markets will provide numerous trading opportunities in both directions for the nimble and discerning trader -- waterfall declines followed by blistering rocket-launch short-covering rallies.  Bear markets never go "straight to zero," nor would we want them to, because it's hard to compound one's principle during a linear move. 

In related news, President Biden just told us to expect food shortages:


That would be a first for my lifetime.  And probably for yours, as well.  But it sure fits with the idea of a Supercycle bear market.

Further related:  The price of ammonia, which is the key foundation of fertilizer, is skyrocketing:


We won't even get into the global bond market (which vastly eclipses the size of the US equity market) today, which just suffered the fastest decline it's seen in decades -- but this is a big deal.  Bond traders tend to be "smart money."  And if the bond market gets "sick," equities cannot be far behind.

I keep hearing equities bulls say things such as "What's the issue?  Rates are still near record lows!"  As I mentioned on the forum, I believe this is the wrong framework.  The relevant question isn't "How do rates compare to historic averages?"  The relevant question is: "How much of current economic activity is predicated on continued low rates and Fed pumping?"  My suspicion is:  A great deal of it.

So the table is set here, fundamentally, in a way we haven't seen since 2007 or so.  And really, the potentials are far worse than 2007 in many ways (as we'd expect, if my belief that the "Great Recession" was actually a lower degree bear than the one we're about to enter is correct).  For example, if we were to start suffering food shortages in America, where does that lead?  Mass rioting might be a start.  Total chaos in major cities, if it continues.  Hungry people do crazy things.  Even otherwise good people will break laws if their families are starving.

So again, bears should be patient here.  And maybe, if they take a broader view of things, they should even take a moment to appreciate what we still have, while we still have it.  How long until the title I gave this piece is more than just words on a page?  

Trade safe.

Friday, March 25, 2022

SPX Update: No Change

A week ago, I noted that if SPX broke above 4416, it was likely to follow through to the upside, and have taken a bullish near-term footing in every post since.  Yesterday, SPX closed more than 100 points above the 4416 level, so we've taken the right approach.  We are in the ballpark of the first red wave 3 inflection, so it wouldn't be unusual for a fourth wave correction to show up soon:


At least, for now we're going to presume that the next correction will be a fourth wave.  As noted on the chart, we are getting into territory where some of the more complex patterns, such as a WXY (which is a pattern that would give bears a larger drop than the mere fourth wave does), at least become possible, though not necessarily likely yet.  Patterns such as the WXY have to be treated as outliers, not because they're impossible, but simply because they show up with far less frequency in these types of positions.  In the end, though, it's often a game of probabilities, and sometimes the roulette wheel lands on 00, even with the odds stacked against it -- which is why I mention these other options, even if I'm not "betting" on them at this stage.

In conclusion, this week has been a hit for the preferred count, and while other patterns are becoming possible, we'll continue to lean toward the "big C wave" count until the market gives us some sound reason not to.  Trade safe.