Very long-term, SPX is now below its key blue line:
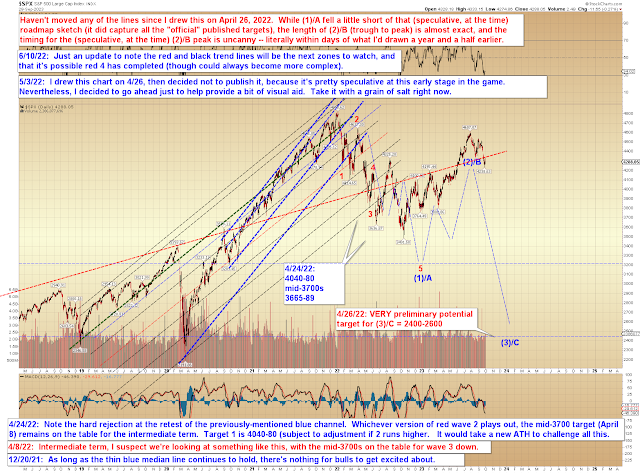
Finally, I was looking through last year's chart book, and I just had to share this, because it's weird. First, remember back on May 3, 2022, when I published this chart? (I actually drew the chart in April 2022, but didn't publish immediately.)
So here's what's weird... this is the chart as it looks in my old chartbook now:
Anyway, (3)/C's timing seems a bit aggressive to me from where I sit now, but sometimes these charts almost draw themselves and can end up being smarter than me, if that makes any sense. So we'll see how that goes. But, however (3)/C goes, the timing of (2)/B (timing is not something I put any conscious thought into) seemed just a bit unreasonable to me.
Oh, almost forgot, gold has opened an option worth being aware of:
In conclusion, presently, the pattern still suggests that the current bounce is most likely a fourth wave, to be followed (after it completes) by a fifth wave below last week's low. If anything changes there, we'll discuss that as appropriate. Trade safe.


No comments:
Post a Comment