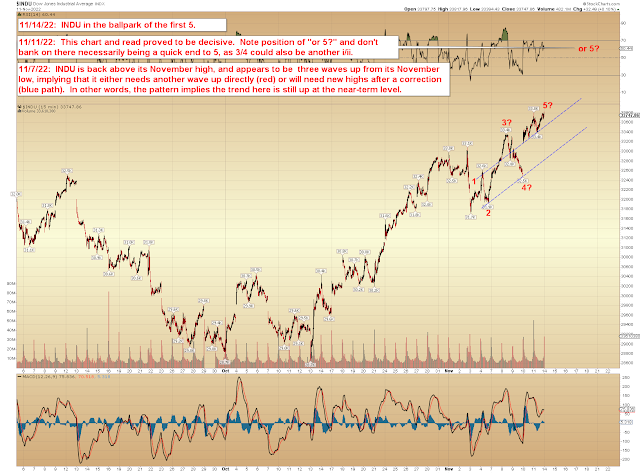
If SPX doesn't resume rallying directly, the first meaningful zone to watch for possible support is probably 3905-3925... I mention this zone because the SPX 24 hour chart (ES+SPX) appears to be three waves up into its high, which suggests that either the rally since 3941 (on that chart) is incomplete to the upside, or that the larger wave (going back to the start of the rally) is incomplete to the upside. In other words, this chart seems to suggest more upside either now or later.
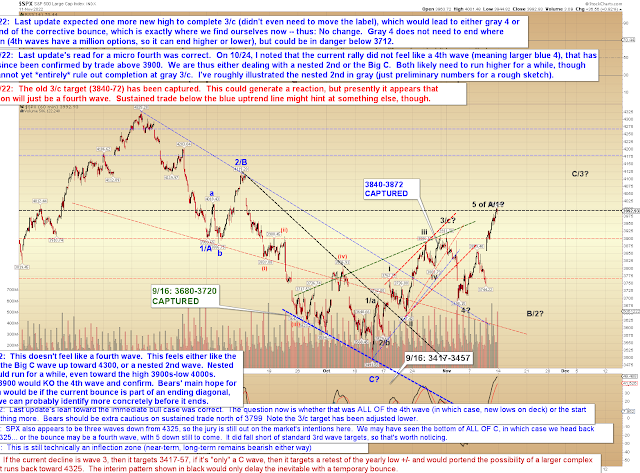
That said, this chart (below), which I haven't updated since November 2 and intentionally haven't updated today, is interesting and shows the market tagged resistance at Friday's high:
In conclusion, if SPX cannot get back above 3990 fairly quickly, it does have options for a correction toward the 3930s, then the aforementioned 3905-25 zone. If that zone fails, there are several smaller potential support zones below it (3886-96; 3861-74; I won't list them all here), but the bigger B/2 correction shown on the old non-updated chart (final chart) would then at least be on the table, too. However, let's not get too far ahead of the market yet, as the SPX24 chart (second chart) seems to suggest we're not quite to the bigger B/2 just yet -- though this pattern has grown increasingly messy in recent days, so we'll take it as it comes. Trade safe.


No comments:
Post a Comment