Amazon

Monday, October 31, 2022

SPX Update: "Not a Fourth Wave" Confirmed

On 10/24, in an update titled More Cause for Bear Caution, I wrote multiple times that the rally didn't "feel" like a low degree fourth wave to me, implying that it was going to head more than a little bit higher, and that has since been confirmed.

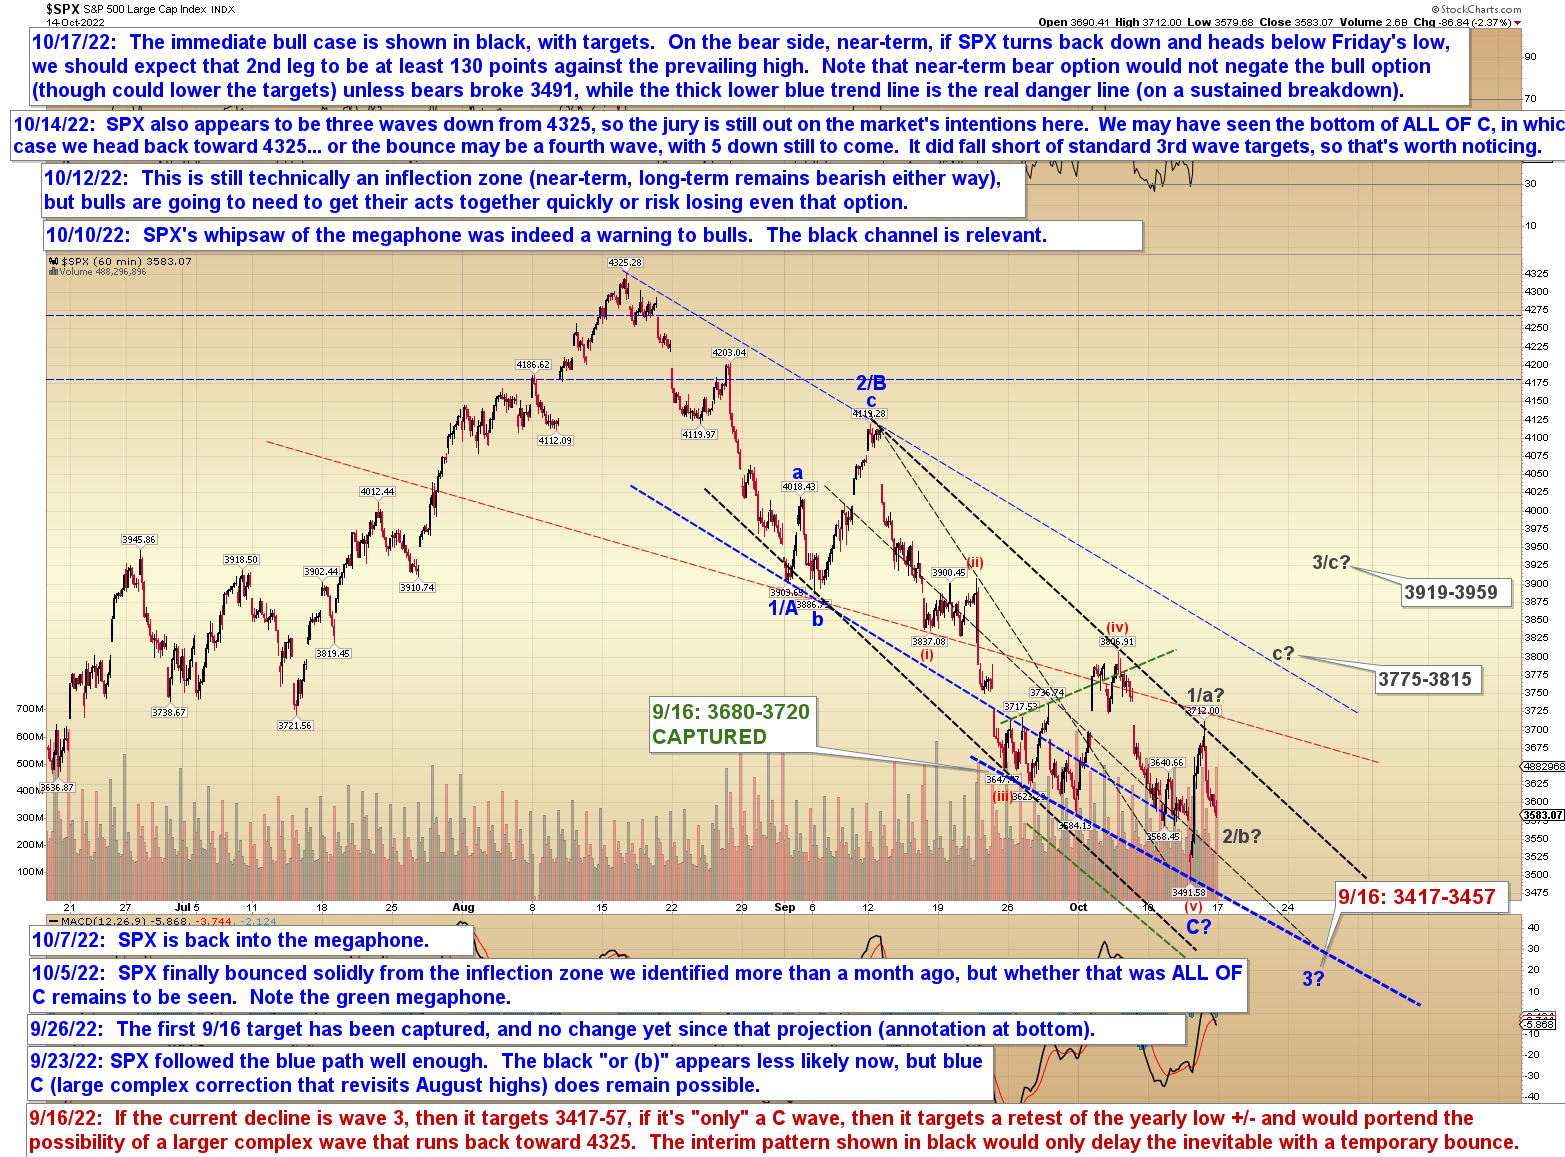
I also wrote:  "Big picture, presently I'm slightly leaning toward this either being the Big C wave that we've discussed a million times, or a nested 2nd wave," and presented the following chart, with the nested 2nd and the Big C wave terminuses shown in red and blue respectively:


Here's that same chart with the updated price action now:


SPX has gotten a lot closer to Red 2, but it's still not there yet, obviously.  So that's the bull case, and it's the way I'm still slightly leaning -- but let's take a quick look at the bear case, which we'll discuss after the chart:


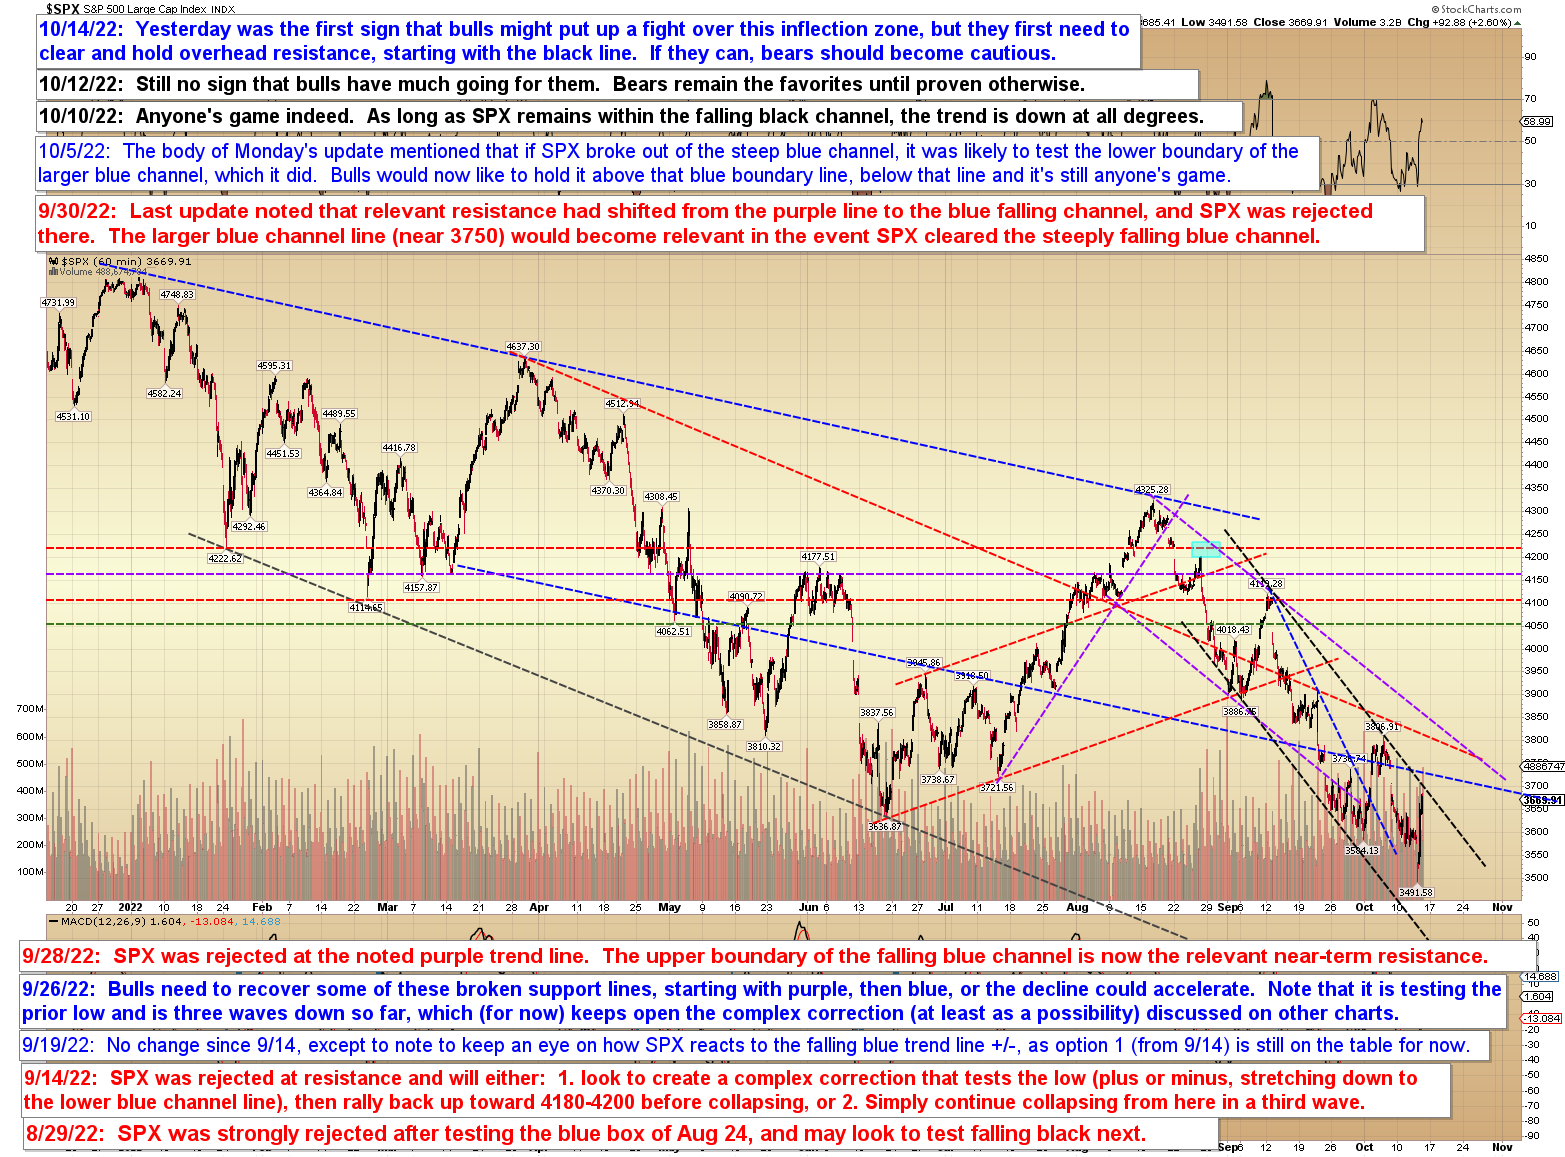
The bear case says that we've about completed 3 waves up (gray 3/c), and because three waves can complete a corrective move, it is indeed always possible for any structure to terminate at such an inflection.  If we refer back to the first chart, we can also see that SPX is backtesting the lower rising black trend line -- so I'm not entirely closed to the idea that maybe this will be it for the bounce.  I'm very much open to it, I'm just not presently leaning that way, as I wrote on the 24th.

So, in conclusion, we are at (3/c could have completed on Friday, though it would look a little better with a bit more upside first) or approaching a bear inflection zone, and it's going to be tricky, because even the bull count would likely correct lower from that inflection (in gray 4? on the second chart), so both counts will seem up in the air for a time.  That said, I'm still slightly inclined to think bulls get more rally after that correction, but as I said, I'm very much open-minded to the bear potential, so when that correction occurs, I'll mark the zones to watch.  Trade safe.

Friday, October 28, 2022

SPX and TLT: Last Monday's Update Absolutely Nailed TLT

Last update noted that COMPQ had reached intermediate resistance and that SPX had captured its next upside target, and that this could generate a reaction, which would most likely be a fourth wave.  We've had the anticipated reaction, now we find out if it is indeed a fourth wave.  No change to the chart below (the annotation is from 10/26), but I did add a bit more detail to the (seemingly most likely) micro wave count.  Note that gray iv has some room to play around a bit if it wants:


Next, let's take a look at Monday's if/then price projection, which has played out pretty well so far:


Also, let's revisit COMPQ, which is probably responsible for the market's hesitation here:


The caveat regarding the potential micro fourth wave and how it contrasts with COMPQ is that this is intermediate resistance, so as I warned in the last update, bulls probably shouldn't get complacent just yet.  

And last, a quick follow up:  On Monday, for TLT, I issued the first warning I've given to bears in a long time, writing:

Finally, TLT is firmly into its target zone now, so I'm going to give my first warning for "bear caution" since I published this target back in April. As of yet, there's nothing even vaguely bullish in the chart, but my gut has started saying: "be careful, bears" -- for whatever that's worth.

That turned out to be the exact bottom, and TLT proceeded to launch the largest bounce it's had in 3 months (so far):


In conclusion, by all rights, SPX probably does still need another wave up, but we still have to remain cognizant that this is an intermediate resistance zone, because off-beat patterns do show up every now and then to keep us on our toes.  As long as SPX holds above 3762, nothing gets too complicated yet.  Trade safe.

Wednesday, October 26, 2022

SPX Update: Resistance vs. "The Usual Outcome"

Last update noted that all options pointed to higher prices for the near-term, and that was a hit, as the market indeed ran higher since then.  From last update:

I've outlined a couple options above -- both of them point higher for now. As I noted, bears' remaining near-term hope would be for an ending diagonal (or a b-wave high that runs down to Friday's low, but then runs back up to today's high), but even a diagonal would need to run higher before it ends.

Today, we're going to keep it simple, and just focus on the near-term uptrend line for now:


For the past few updates, I've presented the bull case, so let's take a quick look at the bear hope... but again, referring back to the "keep it simple" approach above, bears need to break the near-term uptrend in order to gain much traction.  So while tagging this overhead resistance line (chart below) isn't reason in itself to be bearish, it is at least reason for bulls not to get too exuberant just yet:


In conclusion, last update opined that the market needed to run higher, and it did... and near-term, this pattern would normally need to continue to unwind higher (assuming it isn't something weird, such as a WXY, which one can never rule out).  That said, COMPQ has reached a potential intermediate resistance zone, so the market may react to that -- and SPX did capture its old 3/c target.  This is a moment where one might want to take a more cautious stance if already long, if nothing else.  If one is inclined more bearishly, then this is an area to watch closely.  Trade safe.

Monday, October 24, 2022

SPX Update: More Cause for Bear Caution

Last update highlighted a near-term pattern in SPX24 and noted:

These can be terminal patterns, in which case a bounce may be imminent, but they can also be nesting patterns -- so while a minor break and whipsaw of the lower line would be perfectly fine, bulls should be cautious if there's a sustained breakdown at lower black.

It turned out that a bounce was indeed imminent, and the cash session began rallying immediately after the open and kept going through the close.  

Let's start off by looking at the next hurdle bulls face, and the possible outcome if they can clear it:


In terms of the wave count, this just doesn't "feel" like a fourth wave to me.  If it is, then it needs to be an ending diagonal, in which case it needs two more new highs anyway:


Big picture, presently I'm slightly leaning toward this either being the Big C wave that we've discussed a million times, or a nested 2nd wave:


Finally, TLT is firmly into its target zone now, so I'm going to give my first warning for "bear caution" since I published this target back in April.  As of yet, there's nothing even vaguely bullish in the chart, but my gut has started saying: "be careful, bears" -- for whatever that's worth.


In conclusion, futures are indicating that SPX will likely clear 3763 on the open, and as I've written previously, I think that bears need to be cautious when it does.  I've outlined a couple options above -- both of them point higher for now.  As I noted, bears' remaining near-term hope would be for an ending diagonal (or a b-wave high that runs down to Friday's low, but then runs back up to today's high), but even a diagonal would need to run higher before it ends.  Trade safe.

Friday, October 21, 2022

SPX and TLT: TLT Captures April's Downside Target

Last update discussed my view that 3762 was a potentially-important inflection zone; since then, the market has held below that level, which keeps open the bearish possibility for 3762 to mark the top of a fourth wave.

Near-term, SPX did break down from the blue uptrend line on the chart below, but I still believe the lower black trend line is the more significant downside inflection:


Zooming in even further, and looking at the SPX24 chart (which combines the cash action with the overnight futures action), we see a scary-looking wedge developing.  These can be terminal patterns, in which case a bounce may be imminent, but they can also be nesting patterns -- so while a minor break and whipsaw of the lower line would be perfectly fine, bulls should be cautious if there's a sustained breakdown at lower black:


Bigger picture, I've outlined some potential targets, relevant only in the event the last high was ALL OF 4, though even at that, let's consider these as tentative right now, as the jury is still out on whether that high was a fourth wave, or just a bullish wind-up:


Finally, TLT has reached my "you're crazy for even suggesting that!" target of 91-94, published in April.  This is absolute carnage, which is why most people thought I was nuts for suggesting this:


In conclusion, the market is still trading below last update's inflection.  If bulls can break out above 3763, then bears should be very cautious for the immediate future; if they cannot, then perhaps that was ALL OF 4 and it's straight on to new lows from here.  Unfortunately, it's still not entirely clear which case this is, but we do have some zones (as outlined above) to watch for clues.  Trade safe.

Wednesday, October 19, 2022

SPX Update: Still Important

Last update, I noted that I was slightly leaning toward the rally continuing, and that lean was correct, as it turns out.  Things get a bit more complicated now.  Let's start with the near-term chart, then we'll discuss a few things afterwards:


First off, SPX fell short of the initial 3775-3815 target -- this is due to the high being a b-wave (I talked about this in our forum) and measuring from that b-wave high instead of the actual end of the impulsive 1/a wave.  When I published this, I was not entirely sure the high was a b-wave, but yesterday it was confirmed (by the market) that it was, so I noted in real-time (on the forum) that we had reached the C=A inflection zone at 3762.  This means that 3762 is of some importance, as that could mark the end of an ABC rally from last week's low.  Conversely, if SPX sustains trade north of 3762, and particularly 3799, SPX may be winding for a stronger move higher, though some of that will need to be determined in real-time, based on the extant wave structure.

The b-wave high is why I adjusted the 3/c target lower.

Still looking at the chart above:  If the decline continues, the next test will be the rising blue trend line, but I think the more important zone is probably the falling black trend line, currently crossing 3635ish (and falling).  I say this because it's not uncommon to see such trend lines back-tested before the resumption of a rally, so, if SPX chooses to test that line at all, then bears would need to see that back-test fail.  The most bullish case would be a back-test that holds, then a breakout over 3762, which could suggest a strong countertrend rally underway.  Of course, if yesterday's low holds, then bulls can just go grab lunch or something.

Bigger picture, things are unchanged, since SPX is still within the range of the past several weeks:


In conclusion, last update's lean was correct, but I don't have another strong lean at the moment, so for now will have to suffice with knowing that yesterday's high (plus a little) is a near-term inflection zone.  Range-bound markets tend to muddy things, but how the market reacts from here will be telling, so hopefully the picture will clarify further for the next update.  Trade safe.

Monday, October 17, 2022

SPX Update: Longest Inflection Zone Ever

Back in August, I first publicly discussed the current zone as an inflection zone, and it seems like we've been discussing it almost daily ever since.  I'm getting so tired of talking about it (and, of course, of the market being in it) that I even tried looking up "World's Longest Inflection Zone," but all Google suggested was that this record was held by a woman named Ida May Johnson of Orem, Utah... and I'm pretty sure that's wrong.

Anyway, yes, we're still in the inflection zone and apparently always will be.  Best I can determine, this is some type of trading Purgatory we've all been sentenced to, probably for making fun of Ben Bernanke's beard all those years ago.

No!  Of course, I'm only kidding!  Obviously, Ben Bernanke's beard was truly an object worthy of scorn, so no just Deity would punish us for that.  

Must have been something else.

Big picture can be summed up as, shockingly, "no material change":


Near-term, I have drawn up some potential targets in the event the market can break out (i.e.- up) of Purgatory:


Finally, just the simple trend line chart:


In conclusion, I still believe bears need to be cautious if SPX can sustain a breakout over resistance, potentially very cautious -- but so far, it has not done so, though as of this exact instant, I'm slightly leaning toward the idea that it will (just a lean, though, and I might reassess that if we head much below 3540 SPX).  On the downside, bulls should be very cautious if SPX were to sustain trade below the thick blue lower trend line.  Trade safe.

Friday, October 14, 2022

SPX and BKX: Careful Out There...

Last update noted that bulls hadn't done anything encouraging yet, and they hadn't -- but the market is a dynamic environment, and bulls have finally taken the first potentially positive step toward turning things up from the inflection zone.  There are two things to note about the price point of yesterday's bounce:
  1. It's a bit deeper than would be expected from a standard c-wave
  2. It's a bit shallow for a standard third wave
The bounce effectively came from smack between the c-wave and third wave target zones.  What does that indicate?  Well, if it's the c-wave, it may simply indicate the magnitude of long-term selling pressure (note that this will not stop this bounce from now turning into a vicious rally).  If it's a third wave, then it probably isn't done yet.  It's a bit early to say, but the charts below will help outline some zones to watch, starting with BKX:


SPX also seems to show three waves down, though it's much less clear on SPX:


Finally, the simple trend line chart helps identify the next overhead resistance zones:


In conclusion, if SPX clears resistance, I do not believe bears should be quick to short this rally until it becomes a bit more clear what the market wants to do here.  If that was the bottom of the C-wave inflection we've been discussing, then the forthcoming rally is going to be so fast and brutal that it will fool many people into declaring the bear market to be "over" (it will not be over, though).  It will also rally hundreds of SPX points, and nobody wants to endure that sort of drawdown, or endure the "death by a thousand cuts" of shorting/stopping out, shorting/stopping out.  I recommend awaiting an impulsive decline to at least mark a zone to short against (not trading advice).

So the bottom line is, it's too early to say if this is just a short-lived dead cat bounce or the start of the larger C-wave rally -- but both options are very much on the table, so it's wise not to get tunnel vision.  Trade safe.

Wednesday, October 12, 2022

SPX Update: They Shoot Markets, Don't They?

Since last update, SPX has remained range-bound, which is probably not what bulls want to see.  Technically this is still within the near-term inflection zone (big picture remains bearish either way), but so far there's been nothing to give bulls hope.


On the simple trend line chart, bulls would first need to sustain a breakout above the black channel:


In other news, TLT is now within spitting distance of my April target:


On that subject, it seemed like a good time to bring the 10-year yield chart (also originally from April, and last updated in August) forward:


Finally, I realized that I forgot to include the target zone for oil's primary third wave, which is 249-285, so I added that to last update's annotation:


In conclusion, there's no real change from the past few weeks of updates, but so far bulls are not seeing much to give them near-term hope.  The long-term outlook remains bearish either way.  Trade safe.

Monday, October 10, 2022

SPX and Oil Updates

On October 5, I wrote:

[Y]esterday's violent rally could be the start of the complex blue 2 on the final chart, but I'd caution against reading too much into a "one day rally." Bulls will need to see some follow-through before getting their hopes up too much.

And last update concluded:

So far, bulls have not proven they have even the near-term ball, and it is still possible that this is all part of an intermediate bear wave.

Both of those warnings proved to be useful, and Friday's market dropped precipitously.  So far, the decline from last week's high appears to be three waves, so it's in the ballpark of a near-term inflection zone, but could simply be an incomplete impulse wave (which would mean more downside to come after some small fourth wave corrective rallies).


The simple trend line chart has remained useful:


No change to the big picture, but bulls are running out of real estate:


Finally, this seemed like as good a time as any to update the 11+ year-old legacy oil chart.  It's possible that ALL OF 2 down is complete, but the last wave of the decline is far from clear, so it likewise wouldn't be too shocking to see 2-down stretch a bit farther.  


In conclusion, by all rights, SPX looks like it probably needs to run lower still (after some small fourth waves), but this is a near-term inflection zone nested within a larger inflection zone, so that makes this a tougher call.  Trade safe.

Friday, October 7, 2022

SPX Update

Last update concluded: 

[Y]esterday's violent rally could be the start of the complex blue 2 on the final chart, but I'd caution against reading too much into a "one day rally." Bulls will need to see some follow-through before getting their hopes up too much.

So far, there has been no follow-through.  To the contrary, there's been a whipsaw back into the megaphone:


Same with the lower blue channel boundary:


And, big picture, bulls have not hurdled the key trend line yet:


In conclusion, no real change from last update:  So far, bulls have not proven they have even the near-term ball, and it is still possible that this is all part of an intermediate bear wave.  Regarding the "even bigger picture," it is my belief that this is still a bear market no matter what happens here.  Trade safe.

Wednesday, October 5, 2022

SPX Update

For the past week-plus, all we've done is talk about the fact that SPX was sitting smack dab in an inflection zone, so yesterday's violent rally comes as no real surprise.  Unfortunately, a one-day rally does not yet answer anything, and the last bottom isn't well-defined enough for me to make a high-confidence call as to its nature.  Accordingly, I've outlined some things to watch next, on the charts below.

Last update did note that if SPX could break out of the steep blue channel, it would likely rally toward 3750, which it did and then some.


From a wave perspective, there's really nothing to add yet:


Big picture, it's "pay me now or pay me later," and SPX will need to reclaim the broken green line to have a better shot at "pay me later":


In conclusion, yesterday's violent rally could be the start of the complex blue 2 on the final chart, but I'd caution against reading too much into a "one day rally."  Bulls will need to see some follow-through before getting their hopes up too much.  Trade safe.

Monday, October 3, 2022

SPX Update

One of the values of identifying inflection zones in advance is that it can warn us of areas where the market may spend some time seemingly "making up its mind," so to speak.  The current inflection zone has certainly displayed that characteristic, with SPX largely running sideways for the past week:


On the trend line chart, one option to keep an eye on:  First resistance is the steeply falling blue channel, but if SPX breaks out of that channel, it could run to the lower boundary of the larger blue channel.  If it cannot sustain trade back into that channel, it could then reverse again and head back below Friday's lows.  If it can sustain trade back into that larger channel, then next meaningful resistance is the falling black line.


Big picture, we're still in the same place:


And even bigger picture, we have fallen down to an old horizontal support line:


In conclusion, SPX remains stalled in the inflection zone, so there's still not much to add.  Trade safe.