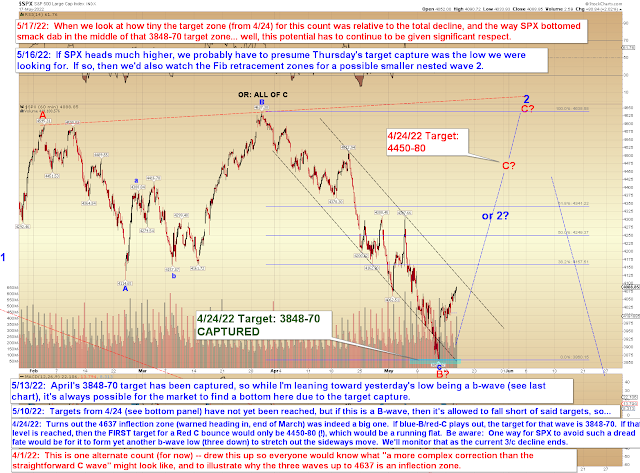
1. The count nobody else saw that we've been watching for a month straight (as a slight odds-on favorite) which just happened to bounce right from the center of its very narrow target zone versus2. The "well, that low kinda looked like a b-wave" count that only appeared the same day as the low, and which just about everyone sees.
(smacks forehead)
I mean, when I look at that narrow target zone drawn to scale on the chart above, I just have to shake my head.
But hey, it wouldn't be trading if everything was spelled out for us all the time (because if it was, then we'd all only need to place like half a dozen more trades leveraged to the hilt and could then retire as billionaires), so here's the more immediately bearish option. Though I have to say, when I chart it out at the micro level (as I did here), it's a little challenging to resolve the rally as a completed C of 4 -- it looks more like a 1/A with an ongoing complex 2/B correction in progress.
And finally, BXK reached its next target zone:
In conclusion, yesterday's high looks like a make-or-break for near-term bears. If they can hold the market below that, then the b-wave low remains possible, so yesterday's high is the final inflection for that option. If you're more bullishly inclined, then the second chart highlights a couple of near-term inflection zones (though not the "only" inflection zones) going the other way. Both counts point down for the very near-term, but the bull count will hold this month's low and rally again while the bear count just continues lower. Bigger picture, both counts are ultimately still bearish. Trade safe.


No comments:
Post a Comment