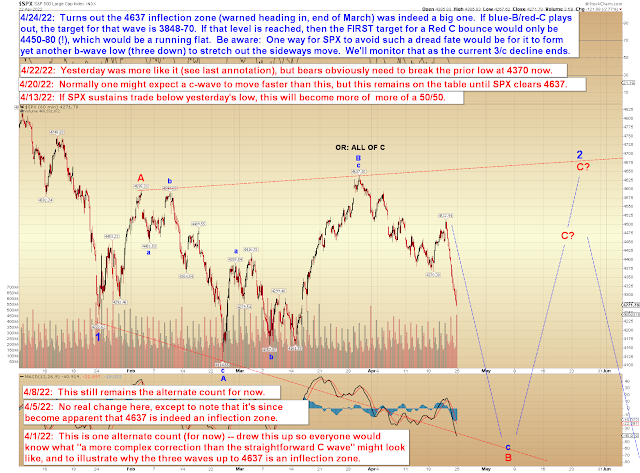
Let's start with the intermediate term, because this projection is something of an "all roads lead to this." In other words, while the market has a number of options over the near-term, the only thing that can kick this off the table is a new all-time-high.
Intermediate term patterns are generally much easier to predict than day-by-day patterns, as the market always has a million and one ways to get where it's eventually going. So if you're confused by the near-term options below, then just refer back to the chart above for clarity.
First up, the used-to-be-alternate count:
Next, the near-term chart that shows the diagonal still in play (for now, meaning as of Sunday night when I drew the chart and am writing this), and since the e-mini futures have captured Target 2 in overnight trade, I added targets 3/4 in the event SPX sustains trade below T2:
In conclusion, while there are still numerous options for the near term, the intermediate term chart and the mid-3700s target zone from April 8 helps clear the noise. Trade safe.


No comments:
Post a Comment