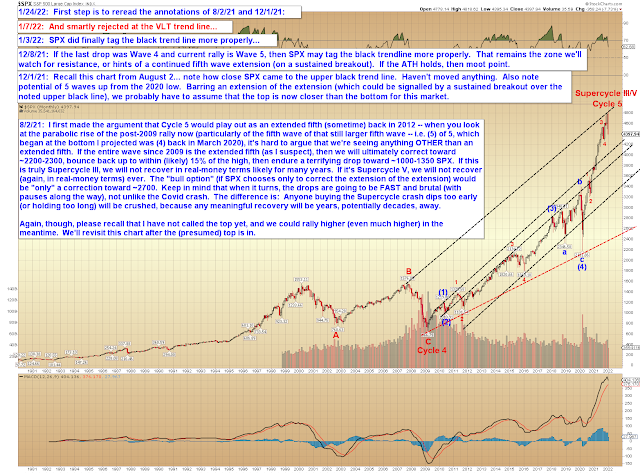
In December, I began warning that it may be "time to sell the rallies" and reiterated a number of times that it was my belief that "the top is closer than the bottom." I cited the very long-term trend line on the chart below as my "line in the sand," and then referred back to this line repeatedly throughout last month.
As one example, on December 20, I wrote:
I hold to my view that the top is closer than the bottom (long-term), unless there's a breakout at the very long-term trend line I've mentioned repeatedly over the past few weeks. That trend line will remain as the first litmus test where I might question my current thesis:
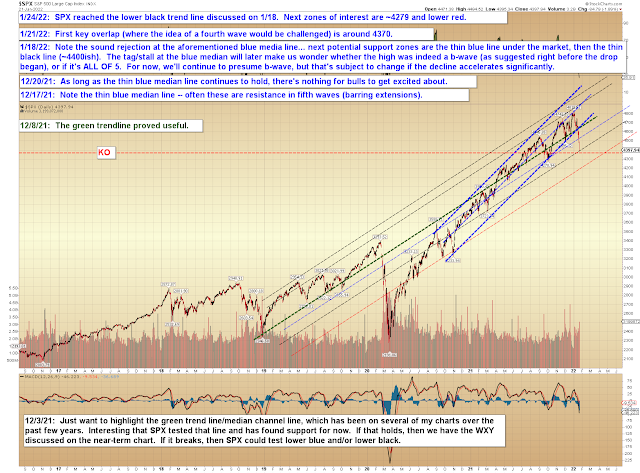
We then tagged that line a few weeks ago, failed to break out (and reversed), immediately began looking for a trip south of ~4495, and the rest has been history so far.
On Friday, we reached the next downside target zone, and futures are indicating this morning that line will break, so the market wants even lower:
In conclusion, I would emphasize that it's important to reread the annotations on the first chart from 12/1/21 and 8/2/21. This market has been playing with fire for a while, and we've known that. We also began looking for a top right at the all-time high, and while the initial lean was for a bottom "below ~4495" (ideally at the black line near 4400 above), if things are more bearish than that, then we haven't missed much. We'll revisit everything on Wednesday and take a look at the near-term then, but nothing that's happening now should come as too much of a surprise. Trade safe.


No comments:
Post a Comment