Before that, though, I'd like to share some interesting data I've gathered from various sources over the past week, starting with this (below). Almost half of the members of SPX, and 76% of COMPQ, have already experienced drawdown equal to or greater than 20%. Almost half of the NASDAQ has declined 50% (or more) from its 52 week highs:
Next, retail investors have remained net buyers during the drop (this can be something of a contrarian indicator, since retail investors aren't considered "smart money"):
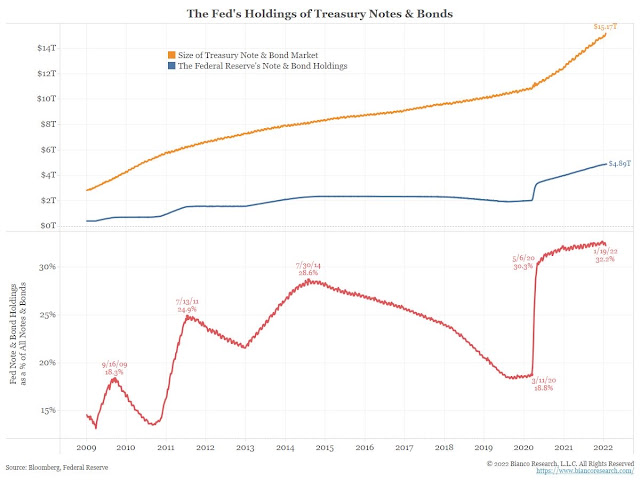
Next, a chart showing that the Federal Reserve's holdings of "Trashuries" is now almost a third of the total market:
Finally, company earnings guidance has turned negative for the first time since April 2020:
Let's move on to the long-term charts, starting with a "legacy" chart of INDU:
Below is another legacy chart, this one of COMPQ, which, unlike INDU, has already tagged its noted trend line:
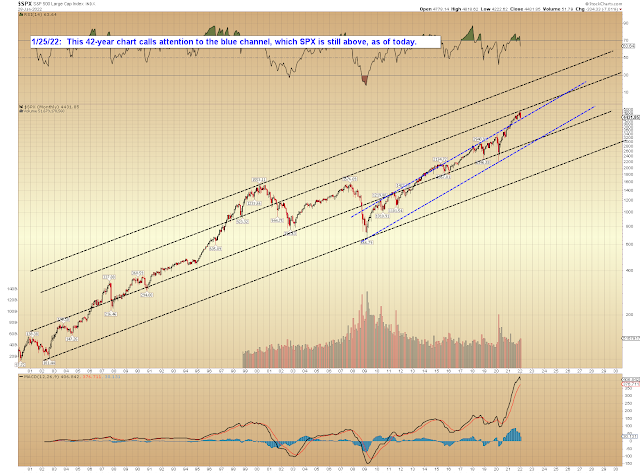
SPX very-long-term trend line (again) below. Are you sensing a theme here...?
Finally, the SPX chart that proved incredibly accurate at foreseeing the recent top:
Near-term, one possibility is that SPX is forming a fourth wave triangle. I posted the chart below to the forum during the session on Friday. This count is speculative at the moment, not a "prediction" yet, and would be ruled out if SPX sustains trade over 4453 (which, if it happens, could take SPX toward 4525 or beyond):
In conclusion, as we've seen across markets, there is support at (and a bit below, in one case) the recent lows in the form of long-term trendlines. As long as bulls can hold those, then they at least keep hope alive for a continued bounce, and even for a last trip to overhead resistance (though I wouldn't hold my breath waiting for that; easy to get caught looking in a market like this) -- but in either case, as I preached throughout December, I believe this remains a "sell the bounces" market. Trade safe.


No comments:
Post a Comment