Commentary and chart analysis featuring Elliott Wave Theory, classic TA, and frequent doses of sarcasm.
Work published on Yahoo Finance, Nasdaq.com, Investing.com, RealClearMarkets, Minyanville, et al
Join the ongoing discussion with our friendly, knowledgeable, and collegial forum community here!
Amazon
Monday, December 8, 2014
SPX, COMPQ, BKX: Near-term vs. Intermediate Term
Friday's market didn't perform the way a third wave should, and this has left a number of complex options open. The charts might get a little confusing, so before we get into that, I'm going to give a brief synopsis of my thinking regarding the intermediate term:
1. RUT and NYA have, so far, failed to make new intermediate swing highs. Odds are good that needs to happen before a meaningful top becomes possible.
2. SPY has been up seven out of the past seven weeks. Over the past 18 years, this has happened seven times (go figure). In 100% of those prior cases, the market formed, at best, a minor correction before making new highs. In 0% of those prior cases, the market formed an immediate major top.
3. Last week, we looked at an RSI top study. Given the market's behavior in the past, it remains highly unlikely that any kind of final high is in place.
4. Therefore, while there is not yet enough pattern present to determine the exact depth of any (pending) near-term correction, I do believe it will simply be a correction, and resolve with new highs.
5. I currently believe the odds are good for an intermediate correction to follow after the next rally takes us to (presumed) new highs -- but let's not put the cart too far in front of the horse...
With that out of the way, let's see if I can keep the charts from being too confusing. We'll start with the simple news that BKX (one of several market I had noted) has finally broken its September swing high. We're still waiting on RUT and NYA to follow suit.
BKX near-term, best-guess:
In SPX, the pattern is so complex that I can spot three different options immediately -- and, due to the larger wave lacking a clear structure, there is no high-probability way to differentiate them.
I went 'round and 'round with myself as to how to present this chart in a manner that wouldn't be incredibly confusing, and I eventually settled on leaving the wave labels off for sake of clarity, and simply highlighting the potential target zones.
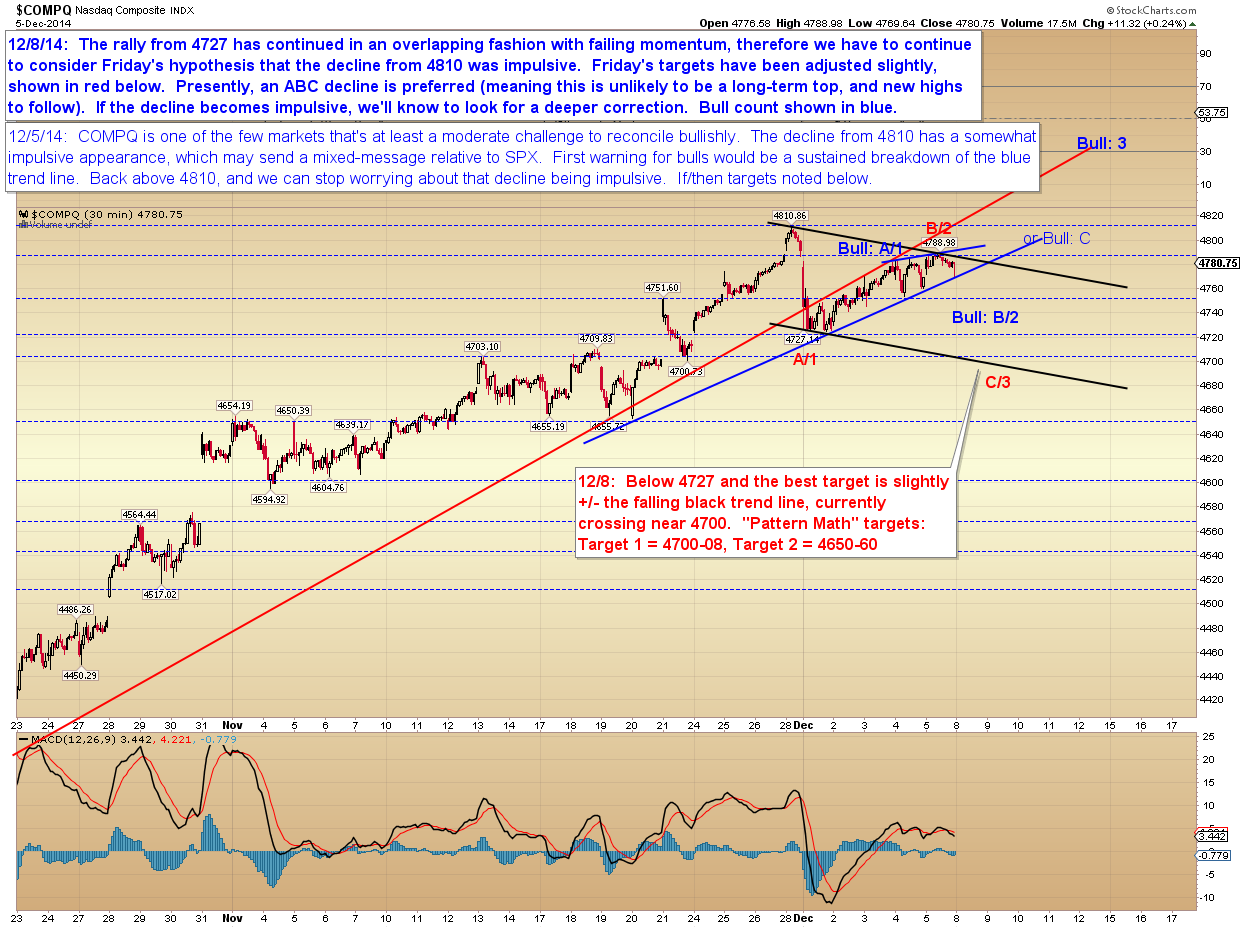
Finally, COMPQ remains the fly in the ointment here. I really want to view that decline as impulsive, yet it's difficult to reconcile COMPQ and SPX. There are two ways they could reconcile:
1. SPX was indeed an ending diagonal, and is aiming at the third target zone or beyond.
2. COMPQ's impulsive decline was wave C of a nearly-hidden flat and the blue bull count plays out.
In conclusion, the near-term is up for grabs. I only have a half-session-worth of decline to draw from, and the pattern leading into that decline is ambiguous at best, which makes it very difficult to draw a high-probability near-term target zone. Intermediate-term, while nothing's impossible, market history tells us that it's unlikely that the final highs are in yet. Trade safe.
Subscribe to:
Post Comments (Atom)


No comments:
Post a Comment