Market’s Liquidity Indicators Begin To Tilt Bearish
The composite liquidity indicator downticked last week on small declines in most of its components. We know that the downtick in the Fed’s pumping to Primary Dealers is temporary, but the weakening in other indicators may not be. Over the course of this latest surge, most of the cash has been targeted at the Treasury market, with stocks getting only an occasional bid. As Treasury supply goes through its seasonal increase, the pace of the advance in Treasuries should materially slow. If the indicator stalls, then both stocks and bonds could be weak. As long as the indicator remains in an uptrend however, Treasuries should continue to rally, and stocks should at least get an intermittent bid.
The following is an extended excerpt from the Primary Dealers section of the report.
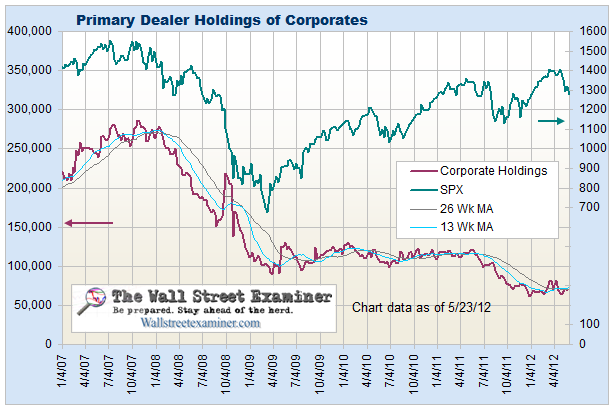
 Primary dealers’ fixed income holdings dropped sharply in the week ended 5/2/12 (reported with a one week lag), after a big increase the week before. When they start reducing those positions that should signal a more persistent rise in yields. They continue to reduce their positions in corporates, a downtrend that has been under way since October 2007 (chart, page 52).
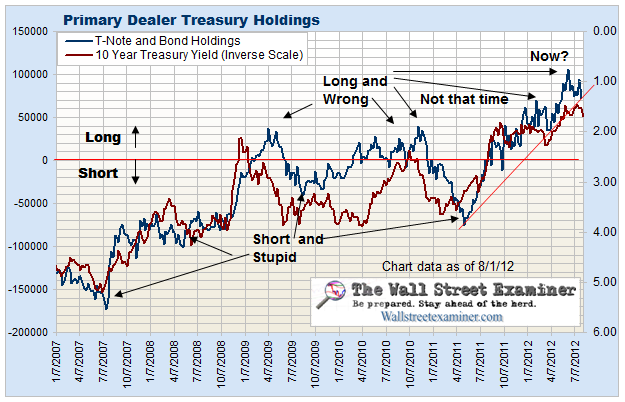
Primary Dealers sold some of their big Treasury long position in the week ended May 2, (reported with a one week lag). Based on the long term chart of the 10 year yield (next page), Treasuries remain at an extreme level of extension from the trend. This looks like a distribution pattern, similar to the one in early 2003.
The dealers are still getting a lot of help from European capital flight and heavy public buying so as long as they maintain their positions at this level, yields should stay low and bond prices high. When this pattern breaks (chart below) is when yields are likely to start trending higher.
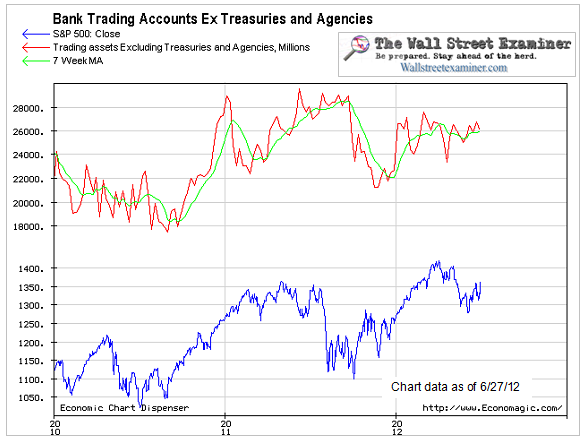
Commercial bank (including foreign based US branches) trading accounts grew by $1.0 billion in the week ended May 2 (after revisions). The short term and intermediate trends of this indicator are now neutral. This indicator is included in the liquidity composite.
The Fed settled no MBS purchases in the week ended May 9. At the same time, purchases and sales under Operation Twist were slightly offset resulting in a small net sale that was not material and will be quickly reversed. The dealers no longer have the benefit of the huge Treasury paydown windfall that they had in mid April. They will suffer the opposite, with increasing levels of new Treasury supply to absorb. That will mute the bullish effects of the Fed purchases of MBS.
There should be a large settlement this week. It may already have occurred or be under way and it is probably part of the reason Treasuries have been so strong for the past couple of days. It is no accident that the Fed schedules these big settlements coincident with the settlements of the 10 year and 30 year bond auctions. This could give stocks a little boost later this week.
If you're interested in subscribing to Lee's service, please click here.


Still working on the charts for the update, but I thought you guys might enjoy this. :)
ReplyDeletebreak 39, say 38 to be safe and we go down
ReplyDeletepoint of no return, next move determines whether up or down at opening
ReplyDeleteHi Pretzel and Katzo
ReplyDeleteI think that today ,, we have come to my mid May cycle - and I see a very potential bullish reversal happening either today/tomorrow. I would say a break above 1350-1352 would confirm this and then a possible rally might occur. But I would love to see a very hard flush today and then a turnaround tuesday later today :-)
That is just my view for now ,, I think they will run markets up into FaceBook on Friday.
Let's move discussion over to the market update, which I just posted.
ReplyDeleteCould be, the counts suggest this possiblility.
ReplyDeleteAlso if you know "Sequential" analysis by Tom Demark , we got on daily chart a "9" yesterday - giving a possibility of exhaustion to the downside and a potential short term bottom due. The question for me remains then how much we will rally if we indeed rally - but I think that from today we should be very close of some kind of bottom in the markets. The break above 1350-1355 will imo confirm that a bottom have been made for now as I see it it today. So far bulls still in 100% control ,, but could reverse today.
ReplyDeleteOn a longer term view I think the coming "rally" will end up in June and then we could see a possible wave 3 or crash type of move down in the markets (like we saw in August 2011).
Action after a DeMark 9 buy set-up: Doesn't that imply at least a 2-4 day "relief" sideways to up market - then the countdown to a 13 buy set-up?
ReplyDeleteThanks for sharing this. The Euro COT indicator from McClellan seems to indicate a boost in liquidity for June.
ReplyDeletehttp://www.mcoscillator.com/learning_center/weekly_chart/eurodollar_cot_indication_calls_for_big_stock_market_top_now/